Elliott wave analysis of EUR/NZD for June 28 – 2016

Wave summary: We are looking for slightly more correction in wave (ii) closer to 1.5895 before turning lower in wave (iii) towards 1.4490. In the short term, a break below minor support at 1.5484 will confirm that the correction in wave (ii) is complete and wave (iii) lower towards 1.4490 is developing. Trading recommendation: We […]

Stock Trkr
Elliott wave analysis of EUR/JPY for June 28 – 2016

Wave summary: We are looking for minor resistance at 113.24 being able to protect the upside for the next stage of the decline towards 107.87 to end wave iii and set the stage for a larger correction in wave iv to 113.28 before moving down again in wave v. In the short term, a break […]

Stock Trkr
Daily analysis of Silver for June 23, 2016

Overview The silver price shows clear bullish attempts now moving away from the EMA 50, thus supporting our expectations for bullish trend continuation today. Its first target is at 18.00. Therefore, the bullish trend scenario will remain valid and active for the upcoming period. It might be preceded by some slight bearish bias affected by […]

Stock Trkr
Gold. Q1-2016 Results

Klondex Mines reported again good Q1-2016 results and is full on track to meet production guidance, Jochen Staiger, CEO, Swiss Resource Capital AG. You can view this video and the full video archive on the Dukascopy TV page: http://www.dukascopy.com/tv/en/#187011 Смотрите Dukascopy TV на вашем языке: http://www.youtube.com/user/dukascopytvrussian 用您的语言观看杜高斯贝电视: http://www.youtube.com/user/dukascopytvchinese Miren Dukascopy TV en su idioma: http://www.youtube.com/user/dukascopytvspanish […]

Stock Trkr
New Copper Production

Altona Mining and SRIG from China signed a 240 Mio. US$ deal to bring the Little Eva mine in production by 2019, Jochen Staiger, CEO & Founder, Swiss Resource Capital AG. You can view this video and the full video archive on the Dukascopy TV page: http://www.dukascopy.com/tv/en/#187229 Смотрите Dukascopy TV на вашем языке: http://www.youtube.com/user/dukascopytvrussian 用您的语言观看杜高斯贝电视: […]

Stock Trkr
Brazil Resources. Gold

Brazil Resources acquires advanced gold projects and bought in the last 3 years 5 resource projects in Brazil and Alaska, Jochen Staiger, CEO, Swiss Resource Capital AG. You can view this video and the full video archive on the Dukascopy TV page: http://www.dukascopy.com/tv/en/#187004 Смотрите Dukascopy TV на вашем языке: http://www.youtube.com/user/dukascopytvrussian 用您的语言观看杜高斯贝电视: http://www.youtube.com/user/dukascopytvchinese Miren Dukascopy TV […]

Stock Trkr
Gold. Negative Interest Rates

Negative interest rates are now normal in the world of sovereign debt with over 51% of all real interest rates are negative of the sovereign debt in the world, Jochen Staiger, CEO, Swiss Resource Capital AG. You can view this video and the full video archive on the Dukascopy TV page: http://www.dukascopy.com/tv/en/#186999 Смотрите Dukascopy TV […]

Stock Trkr
Silver Technical Analysis for June 21, 2016.

Technical outlook and chart setups: Silver is seen to be trading at $17.45 levels at this moment, drifting sideways. The metal should be looking to drop lower and break below $17.10 levels going forward. The wave structure indicates that Silver should be correcting lower in 3 waves towards at least $16.30/50 levels if not lower. […]

Stock Trkr
Mining News. Silver

Endeavour Silver is in the mood to finance another 40 Mio. $ for their future growth. The production is generating positive cash flow and the company is working on their 4th mine Terronera and just bought into Oro Silver with the El Campo project which should become the 5th mine and production site then. Jochen […]

Stock Trkr
SILVER CFD Live Price Chart

Related Posts:Technical Analysis of Intraday Price Movement of Filecoin… April 7, 2024 With the appearance of the Bullish 123 pattern which is…Technical Analysis of Intraday Price Movement of Bitcoin… April 7, 2024 On the 4-hour chart of the Bitcoin cryptocurrency, it appears…Technical Analysis of Intraday Price Movement of AUD/JPY… November 8, 2023 With a price […]

Stock Trkr
Precious Metals Take Center Stage….Let’s Follow the Yellow Brick Road

By Jeff Thomas

For over a hundred years, it’s been theorised that author L. Frank Baum wrote his 1900 book, “The Wonderful Wizard of Oz”, as a fanciful way to explain the economic situation at the time and that the Yellow Brick Road was a reference to the path created by gold ownership. Whether or not the theory is correct, for many people today, “Follow the Yellow Brick Road” might serve as a mantra for alleviating economic woes.

What will happen is that one day, gold will suddenly be up $100 per ounce, then the next day, $200 per ounce. At first the pundits will be claiming that it’s an anomaly, but as it continues rising, a point will be reached when the average person says to himself, “This seems to be a trend. I’d better buy some gold.” 

Unfortunately, once the trend is underway, the price that day will have no bearing on whether gold is available. Your local coin shop may be sold out. If you go online, the mints may say that demand is exceeding supply. Large entities will be buying all they can get and the smaller buyers will be way down on the order list, unlikely to take delivery of even a single ounce.

These Are the Good Old Days

Gold has experienced a four year bear market and only recently has begun to rise again. But is it in reality a barbarous relic? Not by a long shot. For over 5,000 years, whenever people have experienced erratic economic periods, they’ve bought gold in order to stabilise their economic position. This has particularly been true whenever fiat currencies have been on the rise and were in danger of hyper-inflating, as in recent years. Most currencies are in decline against the U.S. dollar—a currency which, itself, is very much in danger of collapse in the not-too-distant future.

In the ’70s, I was buying gold in London, as it rose from $35. It reached a high of $850 in January, 1980, then crashed. When gold dropped below $400, I began buying Krugerrands. Sounds like a bargain, and yet, word on the street was that gold was headed further south. But I was buying long. I was not playing the market; I was building my economic insurance policy. I wasn’t too fussed over price fluctuations, as my gold holdings were meant to cover me if my other investments proved to be a mistake.

At present, gold is well above the high of 1989, but, if we adjust for inflation, we see that gold is actually a bargain at present. This excellent Casey Research chart from 2014 explains it better than mere words:


This tells us that $8,800 would not be an unreasonable level for gold today, if conditions were as dire as they were in 1980. However, conditions are far more dire—debt levels are far beyond any historical levels and markets are in a bubble, just waiting for the arrival of a pin.

A decade ago, when gold topped $700, I predicted $1,500 at some point and even my closest colleagues wondered what I’d been smoking. But it turned out that my prediction was, if anything, conservative. Over the last four years, some of the world’s most informed prognosticators—Eric Sprott, Peter Schiff, Jim Rickards, and Jim Sinclair—have all predicted gold to rise to between $5,000 and $7,000, and some have suggested numbers as high as $50,000. But this hasn’t happened. Are they wrong? No, it just hasn’t happened as of yet.

Conversely, Harry Dent has predicted a drop to $750. So, who’s right? Well, actually, they may all be right. After a crash in the markets, deflation is a certainty, as brokers and investors dump investments of every type in order to cover margin losses. This panic sell off will most assuredly include gold, even though the holders will not wish to sell their gold. This panic promises to create an immediate and possibly very dramatic downward spike in gold.

However, large numbers of long term investors already have their orders in for any price below $1,000. If the spike drops below that number, it will therefore be brief, as every ounce that hits the market at $999 is scooped up. In addition, the Federal Reserve will make good on its decades-long promise to roll the printing presses to counter any sudden deflation. That very act will light the fuse on the gold rocket and send it skyward.

Will the Sun Rise in the Morning or Set in the Evening?

The argument over whether gold will drop to $750 or rise to $5,000 is a pointless one. Any understanding of basic economics assures us that we shall see both sudden deflation and dramatic inflation. It’s as natural and inevitable as sunrise and sunset. (By the way, several of the above individuals have standing bets with each other as to the $750 number. The prize? An ounce of gold.)

But it matters little who will win the bets. What matters is the overview. Rickety economic times are now upon us and they will soon morph into crisis times. In such times, precious metals always return to centre stage, as paper currencies and electronic currencies return to their intrinsic worth of zero. Gold does not so much rise against fiat currencies, as fiat currencies collapse against gold.

Most assuredly, we shall see a dramatic rise in gold, but, just as in the ‘70s, the average person will fail to understand why and will simply chase the upward trend. When gold hits $2,000, but no one is willing to sell for under, say, $2,500, those who are chasing the trend will pay the $2,500 and that will become the new price across the board. Then it will leap higher—again and again, as monetary panic grips the investment world. The inflation-adjusted 1980 price of $8,800 should not be a surprise at all—in fact it would be low, as, in the coming years, conditions will be far more dire than in 1980. Gold may well blow through $10,000. Even the $50,000 figure is not impossible, as we shall be seeing a runaway bull market where those chasing the trend carry gold beyond any rational value.

But gold has an intrinsic value. 2,000 years ago, an ounce of gold could buy you a good suit of clothes. That’s still true today. A gold mania will fuel the gold price beyond anything logical, but a correction will be equally inevitable, dropping it to its intrinsic value. We shall see a gold rise for the record books. The wise investor should already have stocked up his supply of physical gold and gotten rid of gold ETFs. He should already have his seat belt fastened and ready for take off. We’re off to see the wizard.

Editor’s Note: Owning gold is the first step to protecting your wealth from stock market crashes, currency collapses or destructive government policies. But there are many other steps you can take to protect yourself during an economic collapse. We put together a free video to show you exactly how. 

Click here to watch this video now.

The article Follow the Yellow Brick Road was originally published at caseyresearch.com.

Get out latest FREE eBooK “Understanding Options”….Just Click Here

Stock & ETF Trading Signals

Stock Trkr
Uranium Production Ahead

Uranium Energy Corp. holds a large portfolio of 20 projects in 5 US states and in Paraguay, Jochen Staiger, CEO & Founder, Swiss Resource Capital AG. You can view this video and the full video archive on the Dukascopy TV page: http://www.dukascopy.com/tv/en/#185549 Смотрите Dukascopy TV на вашем языке: http://www.youtube.com/user/dukascopytvrussian 用您的语言观看杜高斯贝电视: http://www.youtube.com/user/dukascopytvchinese Miren Dukascopy TV en […]

Stock Trkr
The Bear Market in Commodities Is Over…Here’s How Casey Analysts Are Cashing In

By Justin Spittler

It’s official. The bear market in commodities is over. If you’ve been reading the Dispatch, you know commodities have been in a crushing bear market for more than five years. The Bloomberg Commodity Index, which tracks 22 different commodities, has plunged 58% since April 2011.

In January, it hit its lowest level since 1999. Then, commodity prices took off. According to the Financial Times, 15 out of the 22 commodities that make up the Bloomberg Commodity Index are up on the year. The price of oil is up 85% since February. Sugar is up 81% since August. Soybeans are up 33% since March.

The index is up 11%. It’s off to its best start to any year since 2008. And it’s up 21% since mid-January.
According to the popular definition, a bull market begins when a stock, commodity, or index rises 20% from a low. By that measure, commodities are “officially” in a bull market.

You can see how commodities have bottomed in the chart below:


For months, we’ve been saying commodities were close to a bottom..
The 5-plus year bear market in commodities has slammed the world’s largest miners. According to accounting giant PricewaterhouseCoopers, the world’s 40 largest publicly traded miners lost a combined $27 billion last year. To survive, commodity companies have cut spending to the bone. They laid off hundreds of thousands of workers. They sold parts of their business and abandoned projects. Some companies even cut their prized dividends.

This is classic behavior of a bottom..…
As you may know, commodities are cyclical. They go through big booms and busts. That’s because commodities like copper, natural gas, and oil have unique supply/demand dynamics. For example, when oil prices get too low, many companies that produce oil go out of business. Also, when oil prices are cheap, folks are likely to use more of it. You’re likely to drive more when gasoline prices are cheap than when they’re expensive.

Eventually, prices get so low that demand exceeds supply. Prices bottom out and begin to rise. That’s when a commodity bear market turns into a commodity bull market. When a commodity bull market gets going, the gains can be huge. During the 2002–2008 commodity bull market, the Bloomberg Commodity Index rose 172%. Shares of some of the world’s largest mining companies climbed many times higher. For example, Anglo American (AAL.L) returned 464% over the period. BHP Billiton Limited (BHP) returned 1,106%.

The weak dollar has also given commodities a boost..…
The U.S. Dollar Index has fallen 5% this year. This index tracks the dollar’s performance against major currencies like the euro and Japanese yen. The dollar is the world’s most important currency. Most investors “think” in dollars. If you look up the price of sugar, corn, or gold, you’ll see its price in dollars. So when the dollar loses value, it takes more dollars to buy the same amount of a commodity. That’s why a weak dollar is good for commodities.

Still, there’s at least one reason to be skeptical about the rally in commodities..…
Commodities are the “building blocks” of the global economy. And Dispatch readers know that economic growth has come to a standstill. China, the world’s largest commodity consumer, is growing at its slowest pace since 1990. The U.S. is growing at its slowest pace since World War II. Japan’s economy hasn’t grown at all in two decades. When the economy slows, developers build fewer homes, office buildings, and bridges. That means they use less copper, aluminum, steel, and other commodities.

If you’re buying commodities today, make sure to buy ones that can do well while the economy struggles..…
Some commodities depend more on economic growth than others. For example, lumber, which is used to build homes, benefits from the tailwind of a growing economy. Soybean prices, on the other hand, can rise no matter how well the economy is doing. That’s because people have to eat no matter what’s happening with the economy.

So while the Bloomberg Commodity Index is up 11% this year, not every commodity has rallied. Natural gas prices are still down 9% on the year. Copper is down 3%. Meanwhile, soybean prices are up 34% Although several Casey analysts have recommended commodity investments this year, they’ve been very selective about the types of commodities they recommend. This approach has paid off…..

➢ Nick Giambruno, editor of Crisis Investing, used the crash in oil prices to pick shares of a world-class oil company. This stock is up 13% since March.

➢ E.B. Tucker, editor of The Casey Report, used the turnaround in commodities to buy two gold stocks. One of those is up 47% since March. The other is up 31% since April. He also recommended a silver stock that’s jumped 36% since April.

➢ Louis James, editor of International Speculator, is cashing in on the commodity rebound too. One of his stocks has surged 162% since September. Another is up 122% since July. A third is up 63% since March.

Most investors would do well owning just gold..…
As we often say, gold is real money. It’s preserved wealth for thousands of years because it has unique set of qualities: It’s durable, easy to transport, and easily divisible. It has intrinsic value that folks recognize around the world. Like many commodities, gold “officially” entered a new bull market earlier this year. It’s in an uptrend, yet still cheap. It’s trading 34% below its 2011 high. Unlike many commodities, gold can do well even if the economy is struggling. It’s a safe haven asset that’s protected wealth through history’s worst financial crises.

Casey Research founder Doug Casey thinks we’re on the verge of a major financial crisis..…
Doug says the coming crisis will be “much more severe, different, and longer lasting than what we saw in 2008 and 2009.” When it hits, “paper currencies will fall apart, as they have many times throughout history.”
Doug says this will spark a “true mania” in gold. That’s why we encourage everyone own physical gold. Putting just 10% or 15% of your wealth in gold could help you avoid big losses during the next financial crisis.

Finally, an important announcement from Jim Rickards..…
Part of our job at Casey Research is to share interesting opportunities with you. That’s why we’re passing along this important news from our good friend Jim Rickards. You’ve probably heard of Rickards. He’s one of the most respected analysts in the business. He’s a gold expert and author of The New Case for Gold. Jim recently launched a new service to help readers take advantage of the coming gold boom. Because he’d like as many folks as possible to read his service, he’s arranged a special deal exclusive to Casey Research readers. You can learn more by watching this free video. In short, if you take Rickards up on his special offer today, he’ll send you two “G-series” gold coins in the mail.

Again, this deal is only for Casey Research readers. Click here for the full story.

REMINDER: Casey Research founder Doug Casey will be in Poland next weekend..…
Doug will be presenting at the “Alternative for Difficult Times” seminar in Warsaw on June 18 and 19. Nick Giambruno, editor of International Man, will be there too. Doug and Nick will be there for the Polish launch of Doug’s classic book, Crisis Investing. They will also be presenting at a seminar discussing the impending global financial hurricane, the state of freedom around the world, and how you can protect yourself and even profit from these trends.

Click here for more information.

Chart of the Day

Gold has been one of the best places to put your money this year. Today’s chart shows the performance of gold, commodities, bonds, U.S. stocks, and global stocks this year. You can see gold is up 17% this year. It’s crushed stocks, bonds, and even commodities as a group. For most of this year, gold was the top performing commodity. It was up more than 22% at one point. Then, it cooled off. It’s down more than 3% since late April.

We think gold is in the early innings of a major bull market. And, as we often say, bull markets don’t move in straight lines. It’s healthy for gold to take a “breather” after its red hot start to the year. If you’re looking to buy gold, we recommend using down days as buying opportunities. And again, for specifics on a coming opportunity in gold, we recommend you check out Jim Rickards’ short video right here.

Get our latest FREE eBook “Understanding Options”….Just Click Here!

Stock & ETF Trading Signals

Stock Trkr
Brexit. The Future Of The EU

Official ‘Out’ campaign in the UK’s EU membership referendum gives the case for the UK to leave the EU by focusing on Europe, Matthew Elliott, CEO, Vote Leave You can view this video and the full video archive on the Dukascopy TV page: http://www.dukascopy.com/tv/en/#183689 Смотрите Dukascopy TV на вашем языке: http://www.youtube.com/user/dukascopytvrussian 用您的语言观看杜高斯贝电视: http://www.youtube.com/user/dukascopytvchinese Miren Dukascopy […]

Stock Trkr
Oil, Gas, Mining or Gold?

Sector selection and companies in oil, gas, mining or gold? Dr. Torsten Dennin, Tiberius Asset Management AG. You can view this video and the full video archive on the Dukascopy TV page: http://www.dukascopy.com/tv/en/#184466 Смотрите Dukascopy TV на вашем языке: http://www.youtube.com/user/dukascopytvrussian 用您的语言观看杜高斯贝电视: http://www.youtube.com/user/dukascopytvchinese Miren Dukascopy TV en su idioma: http://www.youtube.com/user/dukascopytvspanish Schauen Sie Dukascopy TV in Ihrer […]

Stock Trkr
Outlook For Crude Oil

The future development of crude oil. Dr. Torsten Dennin, Tiberius Asset Management AG. You can view this video and the full video archive on the Dukascopy TV page: http://www.dukascopy.com/tv/en/#184392 Смотрите Dukascopy TV на вашем языке: http://www.youtube.com/user/dukascopytvrussian 用您的语言观看杜高斯贝电视: http://www.youtube.com/user/dukascopytvchinese Miren Dukascopy TV en su idioma: http://www.youtube.com/user/dukascopytvspanish Schauen Sie Dukascopy TV in Ihrer Sprache: http://www.youtube.com/user/dukascopytvgerman Regardez la […]

Stock Trkr
Time For Precious Metals?

Is now the time to get into precious metals? Dr. Torsten Dennin, Tiberius Asset Management AG. You can view this video and the full video archive on the Dukascopy TV page: http://www.dukascopy.com/tv/en/#184397 Смотрите Dukascopy TV на вашем языке: http://www.youtube.com/user/dukascopytvrussian 用您的语言观看杜高斯贝电视: http://www.youtube.com/user/dukascopytvchinese Miren Dukascopy TV en su idioma: http://www.youtube.com/user/dukascopytvspanish Schauen Sie Dukascopy TV in Ihrer Sprache: […]

Stock Trkr
Commodities And Currencies

Commodities and currencies. Dr. Torsten Dennin, Tiberius Asset Management AG. You can view this video and the full video archive on the Dukascopy TV page: http://www.dukascopy.com/tv/en/#184387 Смотрите Dukascopy TV на вашем языке: http://www.youtube.com/user/dukascopytvrussian 用您的语言观看杜高斯贝电视: http://www.youtube.com/user/dukascopytvchinese Miren Dukascopy TV en su idioma: http://www.youtube.com/user/dukascopytvspanish Schauen Sie Dukascopy TV in Ihrer Sprache: http://www.youtube.com/user/dukascopytvgerman Regardez la Dukascopy TV dans […]

Stock Trkr
Commodity Markets Outlook

Long term commodities development, Dr. Torsten Dennin, Chief Strategist, Tiberius Asset Management AG. You can view this video and the full video archive on the Dukascopy TV page: http://www.dukascopy.com/tv/en/#184274 Смотрите Dukascopy TV на вашем языке: http://www.youtube.com/user/dukascopytvrussian 用您的语言观看杜高斯贝电视: http://www.youtube.com/user/dukascopytvchinese Miren Dukascopy TV en su idioma: http://www.youtube.com/user/dukascopytvspanish Schauen Sie Dukascopy TV in Ihrer Sprache: http://www.youtube.com/user/dukascopytvgerman Regardez la […]

Stock Trkr
Silver From Mexico

Market challenges, silver markets today and results 2015/2016, Bradford Cooke, CEO, Endeavour Silver Corp. You can view this video and the full video archive on the Dukascopy TV page: http://www.dukascopy.com/tv/en/#183665 Смотрите Dukascopy TV на вашем языке: http://www.youtube.com/user/dukascopytvrussian 用您的语言观看杜高斯贝电视: http://www.youtube.com/user/dukascopytvchinese Miren Dukascopy TV en su idioma: http://www.youtube.com/user/dukascopytvspanish Schauen Sie Dukascopy TV in Ihrer Sprache: http://www.youtube.com/user/dukascopytvgerman Regardez […]

Stock Trkr
Sustainability Management In Mining

Successful sustainability management in mining in general. How Endeavour Silver handles this? Bradford Cooke, CEO, Endeavour Silver Corp. You can view this video and the full video archive on the Dukascopy TV page: http://www.dukascopy.com/tv/en/#183680 Смотрите Dukascopy TV на вашем языке: http://www.youtube.com/user/dukascopytvrussian 用您的语言观看杜高斯贝电视: http://www.youtube.com/user/dukascopytvchinese Miren Dukascopy TV en su idioma: http://www.youtube.com/user/dukascopytvspanish Schauen Sie Dukascopy TV in […]

Stock Trkr
Sibanye Gold Producer

Outlook for 2016 from a TOP 10 gold producer. Neal Froneman, CEO of Sibanye Gold Ltd. You can view this video and the full video archive on the Dukascopy TV page: http://www.dukascopy.com/tv/en/#183653 Смотрите Dukascopy TV на вашем языке: http://www.youtube.com/user/dukascopytvrussian 用您的语言观看杜高斯贝电视: http://www.youtube.com/user/dukascopytvchinese Miren Dukascopy TV en su idioma: http://www.youtube.com/user/dukascopytvspanish Schauen Sie Dukascopy TV in Ihrer Sprache: […]

Stock Trkr
Rising Gold Production

Nevada gold mining and how to become a 100,000 ounces gold producer? Corrado de Gasperis, President & CEO, Comstock Mining Inc. You can view this video and the full video archive on the Dukascopy TV page: http://www.dukascopy.com/tv/en/#183560 Смотрите Dukascopy TV на вашем языке: http://www.youtube.com/user/dukascopytvrussian 用您的语言观看杜高斯贝电视: http://www.youtube.com/user/dukascopytvchinese Miren Dukascopy TV en su idioma: http://www.youtube.com/user/dukascopytvspanish Schauen Sie […]

Stock Trkr
Gold Gains Reach $1,300

Is “a very fragile European banking system” hurting gold prices? Alasdair Macleod, GoldMoney You can view this video and the full video archive on the Dukascopy TV page: http://www.dukascopy.com/tv/en/#183243 Смотрите Dukascopy TV на вашем языке: http://www.youtube.com/user/dukascopytvrussian 用您的语言观看杜高斯贝电视: http://www.youtube.com/user/dukascopytvchinese Miren Dukascopy TV en su idioma: http://www.youtube.com/user/dukascopytvspanish Schauen Sie Dukascopy TV in Ihrer Sprache: http://www.youtube.com/user/dukascopytvgerman Regardez la […]

Stock Trkr
Mining And Historic Monuments

Social and corporate responsibility in mining, Corrado de Gasperis, President & CEO, Comstock Mining Inc. You can view this video and the full video archive on the Dukascopy TV page: http://www.dukascopy.com/tv/en/#183116 Смотрите Dukascopy TV на вашем языке: http://www.youtube.com/user/dukascopytvrussian 用您的语言观看杜高斯贝电视: http://www.youtube.com/user/dukascopytvchinese Miren Dukascopy TV en su idioma: http://www.youtube.com/user/dukascopytvspanish Schauen Sie Dukascopy TV in Ihrer Sprache: http://www.youtube.com/user/dukascopytvgerman […]

Stock Trkr
Our Next Technical Price Targets for Gold & Silver
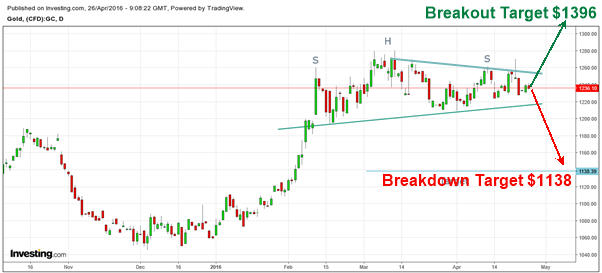
I have pointed out earlier, gold is forming a possible short term top. It is on the verge of completing a bearish ‘Head and Shoulder’ pattern. The pattern is confirmed if gold closes below $1220/oz. The downside pattern target for this setup is $1138/oz. 
If gold starts to rally and breaks out to the upside, then we should see the $1396 level be reached based on technical analysis.
I will open a new long gold position when the time feels right. With technical analysis strongly suggesting gold and silver have bottomed, New breakouts to the upside in metals and mining stocks can be bought.
goldtargets
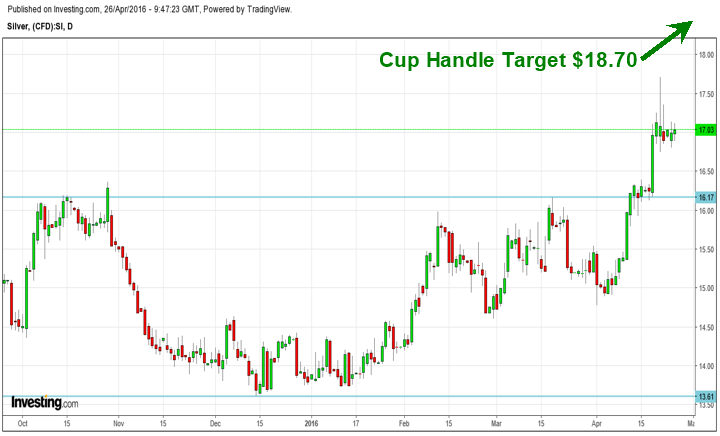
On the other hand, silver has formed an almost perfect cup and handle pattern and has broken out of it. It has reached its first target objective; chances are that silver will either consolidate or pullback after having met its target or move up to $18.70/oz. levels, which is the pattern target of the ‘Cup and Handle’ pattern formation. However, new buying is not advised at current levels due to a poor risk-reward ratio.
If you have not read the post about what the Silver COT data is warning us about be sure to read this short post: Click Here
silvertarget
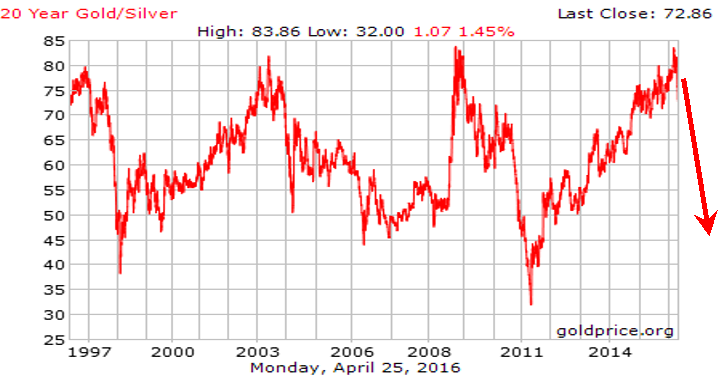
If we take a look and monitor the gold/silver ratio closely, recently, the ratio had touched its resistance of the past 20 years. Every time the ratio has returned from the resistance, the minimum it has retraced is to the levels of 45.
There are no reasons to believe that it will be any different this time around. Hypothetically, if gold were to remain at $1236/oz. and if the ratio corrects to 45, silver will reach $27.5/oz., which is a 62% increase from current levels.
Hence, it is prudent to stay with silver for a better return compared to gold once price has a pause to regroup before the next rally.
ratiotarget
How to Trade Gold & Silver Conclusion:
Buying gold and silver offer different rate of returns to the investors. If an investor is able to time both the precious metals, then the total returns will be ‘astronomically high’ in the future.
My timing ‘cycles’ provide signals both for the short term and the long term. The price action of both gold and silver along with my cycles have been showing VERY strong “Cycle Skew”, which I explain in detail in my book “Technical Trading Mastery”. This cycle skew is telling us that precious metals are now in a strong uptrend and is another confirming indicator that support much higher prices long term.
During the first half of a bull market trading price patterns and upside breakouts tend to work very well. Because interest in the sector is growing and more buyers continue to enter that market, price pattern breakouts are the last chance to get a position before price has its next rally higher.
I will continue to inform my subscribers of new swing trades, and even more importantly the long term investing “Set it and Forget It” ETF trades to ride out the new bull and bear markets for massive profits.
Keep following me to know more at: www.The Gold and Oil Guy.com
Chris Vermeulen

Stock & ETF Trading Signals

Stock Trkr
Believe It or Not, It’s Happening to Gold

Last night as I was going over my charts and running my end of the day analysis the charts jumped out at me with a trade setup and wanted to share my cycle chart for gold with you. The price chart of gold below is exactly what my cycle analysis told us to look for last week WELL ahead of the today’s news and its things play out I as I feel they will then we stand to make some pretty good money as gold falls in value during the month of April.

If you have been following my work for any length of time then you know big price movements in the market like today (Tuesday, March 29th) based around the FED news ARE NOT and SHOULD NOT be of any surprise. In fact, this charts told use about today’s pop 2 weeks ago and we have been waiting for it ever since. The news is simply the best way to get the masses on board with market moves and gets them on the wrong side of the market before it makes a big move in the other direction, most times… not always, though.

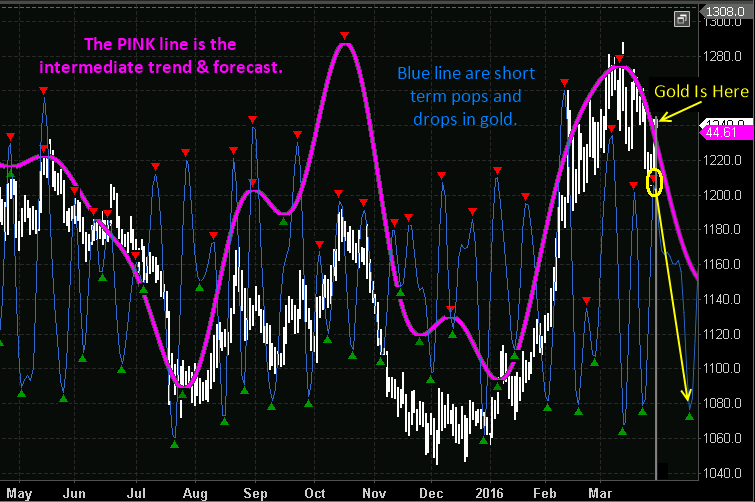
Take a look at this chart below. You’ll see two cycle indicators, one pink and one blue. The pink cycle line is a cluster of various cycles blended together which allows us to view the overall market trend of biased looking forward 5 – 30 days. The blue cycle line is a cluster of much shorter time frame cycles in this tells us when we should expect strong moves in the same direction of the pink cycles or counter trend pullbacks within the trend.

One quick point to note with cycle trading is that the height and depth of the cycle does not mean the price will rise or fall to those levels, it simply tells us if the market has an upward or downward bias. The current cycle analysis for gold along with the current price is telling us that today the short term cycle topped which is the blue line and our main trend cycle is already heading lower. The odds favor gold should roll over and make new multi-month Lows in August.

gold-collapse

In short, we have been waiting for gold to have a technical breakdown and to retrace back up into a short term overbought condition. Today Tuesday, March 29 it looks as though we finally have the setup. Over the next 5 to 15 days I expect gold to drop along with silver and gold stocks. There are many ways to play this through inverse exchange traded funds or short selling gold, silver or gold stocks.

This year and 2017 I believe are going to be incredible years for both traders and investors. If treated correctly, it can be a life changing experience financially for some individuals. Join my pre-market video newsletter and start your day with a hot cup of coffee and my market forecast video.

Sign up right here > www.The Gold & Oil Guy.com

Chris Vermeulen

Stock & ETF Trading Signals

Stock Trkr
Mike Seery’s Weekly Futures Recap – Crude Oil, Natural Gas, Gold, Coffee, Sugar

It’s Saturday and that means it is time for a heads up from our trading partner Michael Seery. We’ve asked him to give our readers a recap of the this weeks futures markets and give us some insight on where he sees these markets headed. Mike has been a senior analyst for close to 15 years and has extensive knowledge of all of the commodity and option markets. 

Crude oil futures in the April contract settled last Friday in New York at 38.50 a barrel while currently trading 40.65 up over $2 for the trading week now trading above its 20 and 100 day moving average for the first time in 6 months. The selloff in the U.S dollar has pushed up oil prices tremendously over the last several weeks. Oil prices are trading higher for the 3rd consecutive day; however this rally has been based on very low volume which is a little concerning as I’m sitting on the sidelines in this market as I have missed the rally to the upside. The U.S dollar has hit a 6 month low and that has propped up many commodity prices and especially crude oil as gasoline and heating oil also have rallied substantially. You will notice this at your local gas station as you are paying much more than you were just three or four weeks ago as the tide has turned in the commodity markets. Rumors are circulating that Saudi Arabia is going to urge OPEC to start cutting production, therefore, pushing up prices even higher as their economy is struggling due to low prices. However, the chart structure is poor and sometimes you miss trades as this did not meet criteria to enter into and that’s exactly what happened to me, as I am leery of this market in 42/45 level as I assume production will come back onto the table because of higher prices.
TREND: HIGHER
CHART STRUCTURE: POOR

He has been killing it in 2016, get Chris “the Gold & Oil Guy” Vermeulen’s Trading Forecasts & Trade Signals Today

Natural gas futures in the April contract is now trading above its 20 day, but still below its 100 day moving average settling last Friday in New York at 182 while currently trading at 194. I was recommending a short position getting stopped out earlier in the week as now I’m currently sitting on the sidelines. Natural gas prices are trading at a 4 week high. However, the chart structure is poor meaning that the 10 day low it’s too far away to meet my criteria to enter into a new trade so keep a close eye on this market as we could get involved to the upside soon. The fundamentals remain bearish. However, that has already been reflected in the price as supplies are huge at the present time, but the bearish short term trend has ended in my opinion. The energy sector has caught fire over the last several weeks as crude oil is now trading at 42 a barrel which has also supported gas prices in the short term, but look at other markets that are beginning to trend with higher potential.
TREND: MIXED
CHART STRUCTURE: POOR

Gold futures in the April contract settled last Friday in New York at 1,259 an ounce while currently trading at 1,254 down slightly for the trading week in a very highly volatile trading manner as prices reacted sharply to the upside off of the Federal Reserve statement of not raising interest rates sending prices up over $40 in Thursday’s trade. At the current time, I’m sitting on the sidelines in this market as I have missed the upside. However, I am not bullish gold at this price level as I think prices are topping out. However I’m not recommending a short position, but if you believe my opinion, I would sell a mini contract while placing the stop loss above the most recent high of 1,287 risking $30 or $1,000 per mini contract plus slippage and commission. Negative interest rates throughout the world have spooked investors back into the gold market as commodities, in general, have rallied as a whole. However, I remain bullish the stock market which continues to move higher as I think money flows will come out of the precious metals here in the short term. Remember when trading commodities it’s all based on risk as the risk/reward on the short side I think is in your favor, but it does not meet my criteria for an official entry into a new trade which has to be a 4 week low, but decide for yourself what’s best for your trading account.
TREND: HIGHER
CHART STRUCTURE: POOR

Check out Adam’s Hewison’s “World Cup Portfolio”

Coffee futures in the May contract settled last Friday in New York at 125.80 a pound while currently trading at 134.50 trading higher for the 3rd consecutive trading session up around 900 points for the trading week hitting a 5 month high. I’ve been recommending a bullish position from around the 121.50 level and if you took that trade continue to place your stop loss below the 10 day low which currently stands at 119 as the chart structure is terrible at the present time due to the fact that coffee prices have exploded to the upside over the last week. The commodity markets, in general, have rallied substantially due to the fact that the U.S dollar has hit a 6 month low and it certainly looks to me that the bear markets are over with in the short term. However, if you have missed this trade the risk/reward is not your favor at the current time as you missed the boat so you must look at other markets that are beginning to trend. The next major level of resistance is the October high around 142 as I think prices could test that level next week as coffee prices are still cheap in my opinion as demand currently is strong. At the current time, I’m recommending a bullish position in cocoa and coffee as the soft commodity markets have certainly caught fire recently including the sugar market so start looking at the commodities to the upside.
TREND: HIGHER
CHART STRUCTURE: POOR

Sugar futures in the May contract settled last Friday in New York at 15.13 a pound while currently trading at 15.86 continuing its remarkable bullish run to the upside hitting a 14 month high as I’m sitting on the sidelines as the chart structure has not met my criteria towards entering into the trade. However, I’m certainly not recommending any type of short position as it looks to me that prices are headed even higher. Sugar futures are trading above their 20 and 100 day moving average telling you that the short term trend is to the upside as the commodity markets have caught fire as who knows how high sugar prices can actually go as production cuts throughout major growing regions throughout the world are causing concerns about carryover levels pushing prices up tremendously over the last 3 weeks. Remember when you trade commodities the trend is your friend and trading with the path of least resistance is the most successful way to trade in my opinion over the course of time so do not sell sugar at this point, but if you have missed this trade sit on the sidelines and look at other markets that are beginning to trend as the horse has left the barn in this market in the short term.
TREND: HIGHER
CHART STRUCTURE: POOR

Get more of Mike Seerys call on commodities this week….Just Visit Here

Get our latest FREE eBook “Understanding Options”….Just Click Here!

Stock & ETF Trading Signals

Stock Trkr
Gold Is Getting Real

Gold is getting back on track and on the radar of investors. Central banks are buying so should the individual investor too and secure his wealth and assets, Jochen Staiger, CEO & Founder, Swiss Resource Capital AG. You can view this video and the full video archive on the Dukascopy TV page: http://www.dukascopy.com/tv/en/#177806 Смотрите Dukascopy […]

Stock Trkr
Gold Rush In Yellowknife

TerraX Minerals is well financed to explore and pre-develop the Yellowknife City Goldproject to a certain stage where it gets exciting for a large company to step in, Jochen Staiger, CEO & Founder, Swiss Resource Capital AG. You can view this video and the full video archive on the Dukascopy TV page: http://www.dukascopy.com/tv/en/#177624 Смотрите Dukascopy […]

Stock Trkr