Not Much Oil Optimism

We’re looking into 2019 before we see the price of oil heading anywhere near $60 per barrel. Spencer Welch, IHS Markit. You can view this video and the full video archive on the Dukascopy TV page: http://www.dukascopy.com/tv/en/#215976 Смотрите Dukascopy TV на вашем языке: http://www.youtube.com/user/dukascopytvrussian 用您的语言观看杜高斯贝电视: http://www.youtube.com/user/dukascopytvchinese Miren Dukascopy TV en su idioma: http://www.youtube.com/user/dukascopytvspanish Schauen Sie […]

Stock Trkr
Russia Will Grow From Crude Priced At $40 Per Barrel

Russia’s economy will grow at 2% with the current oil prices. Alexei Deviatov, Uralsib You can view this video and the full video archive on the Dukascopy TV page: http://www.dukascopy.com/tv/en/#206558 Смотрите Dukascopy TV на вашем языке: http://www.youtube.com/user/dukascopytvrussian 用您的语言观看杜高斯贝电视: http://www.youtube.com/user/dukascopytvchinese Miren Dukascopy TV en su idioma: http://www.youtube.com/user/dukascopytvspanish Schauen Sie Dukascopy TV in Ihrer Sprache: http://www.youtube.com/user/dukascopytvgerman Regardez […]

Stock Trkr
Mike Seery’s Weekly Futures Recap – Crude Oil, Gold and U.S. Dollar

It’s been a crazy end to the week with the results from the Brexit vote in and that means it is time for a heads up from our trading partner Michael Seery. We’ve asked him to give our readers a recap of the this weeks futures markets and give us some insight on where he sees these markets headed. Mike has been a senior analyst for close to 15 years and has extensive knowledge of all of the commodity and option markets. 

Crude oil futures
in the August contract settled last Friday in New York at 48.56 a barrel while currently trading at 47.71 down about $1 for the trading week while selling off $2.50 this Friday afternoon. The U.S dollar is up over 200 points putting pressure on oil and the commodity sector as a whole. Crude oil prices are trading below their 20 day but still above their 100 day moving average telling you that the short term trend is mixed as I’m currently sitting on the sidelines looking for a possible short entry in next week’s trade. Crude prices are retesting last week’s low as a possible top has been created as the Brexit situation is spooking many different markets including stock markets around the world as demand could start to wane over the next several months. The commodity markets do not like uncertainty and no one really knows how this Brexit situation will develop, but I always look at risk/reward scenarios as I do think prices may have topped out in the short term so be patient and wait for the entry criteria to come about. If a short position is initiated the risk is around $1,700 which is too much in my opinion so are going to have to be patient and wait for the chart structure to improve so keep a close eye on this market.
Trend: Mixed
Chart Structure: Improving

He has been killing it in 2016, get Chris Vermeulen’s Trading Forecasts & Trade Signals

Gold futures in the August contract settled last Friday in New York at 1,295 an ounce while currently trading at 1,319 up about $25 for the trading week while skyrocketing this afternoon by $55 all due to the Brexit situation which is pouring money back into the precious metals. At present, I’m sitting on the sidelines in the gold market as the chart structure never met my criteria to enter into a bullish position. However, I am recommending a bullish position in the silver market which is also up about $.50 today as I do think the precious metals are headed higher. Gold prices are trading above their 20 and 100 day moving average telling you that short term trend is higher. The commodity markets, in general, are very weak as all of the interest is back into the precious metals which is used as a flight to quality despite the fact that the U.S dollar was up over 200 points this afternoon. Gold prices are trading at a 2 year high as I do think this trend will continue as stock markets around the world are sharply lower as interest in gold certainly has come back like it was in 2011 when prices traded as high as $1,900 an ounce. Negative interest rates around the world continue to support the gold market and that situation is not going to change as the United States Federal Reserve certainly will not be raising rates in 2016 in my opinion.
Trend: Higher
Chart Structure: Poor

Check out Adam’s Hewison’s “World Cup Portfolio”

The U.S dollar is sharply higher this Friday afternoon trading at 95.53 up 200 points reacting sharply to the Brexit situation as the UK has exited the EU sending the dollar up 300 points over the last 2 trading sessions. At present, I’m sitting on the sidelines in this market as the chart structure is terrible as I’m advising clients to avoid this market currently as volatility is extremely high, but in my opinion, it certainly does look like the U.S dollar has bottomed in the short term. The dollar is affecting many commodities to the downside as nobody wants to hold money in Europe at this point as a flight to quality is taking place. I think that’s going to stay for several more weeks until the dust settles so look at other markets that are beginning to trend with better chart structure as the 10 day low is $3,000 away which does not meet my criteria to enter into a new bullish position. The U.S dollar is trading above its 20 and 100 day moving average telling you that the short term trend is higher so do not sell this market as that would be counter trend trading which is very dangerous over the course of time in my opinion.
Trend: Higher
Chart Structure: Poor

Get more of Mike Seerys call on commodities this week….Just Visit Here

Stock & ETF Trading Signals

Stock Trkr
Crude Oil Retesting $30 Dollars or Lower?
Recently, Light Crude has seen a dramatic 35%+ increase in value.  As the current price continue to flirt with $40 per barrel, the likelihood of a further price rise is on everyone’s mind.  With recent lows near $26 per barrel, what is the possibility that oil will form a base above $30 and attempt a rally?
Historically, the 2009 low price for oil was $33.20.  This level should be viewed as a key level of support for current price action.  The recent price rotation below this level is a sign that oil prices are under extreme pressure in the current economic environment with a supply glut and slower than expected demand.
It is my opinion that the price of oil will continue to reflect the supply/demand aspects of the global markets in relation to global economic activity.  Thus, my analysis is that Oil will likely attempt to retest support, near $30 or below, in the immediate future in direct relation to continued supply production in conjunction with slower global demand.
(Baltic Dry Index Chart – LongTerm)

The BDI Index continues to attempt to push to new lows.  This is a strong indication that global exports and international demand from consumers and business is continuing to diminish.

oila

Crude Oil Analysis & Trade Signals: www.The Gold & Oil Guy.com
(DOWT – Transportation Chart)

Even though the DOW Transportation Index has risen recently, the current direction is decisively bearish in indicates the next level of support is near 6265 – clearly 1400 points below current levels.

oilb

(Baltic Dry Index Recent)

The longer the BDI continues to push to new lows, the more likely we are to see continued contraction in demand for commodities and global exports.  Thus, with the continued supply production throughout the globe and continued global contraction, one could expect that Oil prices will continue to be under pressure globally.

oilc

The simple mechanics of the equation are that certain ME and foreign countries require continued income from oil production/sales.  As the continued decline in Oil prices creates economic pressure, these countries have little alternative but to continue producing and selling as any price to feed their need for dollars.  This creates a mechanism that propels a vicious cycle or over production and sales in an attempt to generate dollars that are desperately needs to fund a relatively mature economy.
As all things are in a constant state of flux, it become important to understand that price rotation in the Oil market will likely continue between $28 and $42 for a period of time.  This is really a traders market in the sense that a nearly rotation level this large, in percentage relation, is available for all traders.  Be cautious of rallies as they may be short-lived. I expect a number of weeks of rotation near $36 ppb followed by a lower price rotation back to near $25 ppb between April 5th and May 5th.
After that price rotation lower, then I expect one of two targets to be tested, $21 ppb or $37 ppb.  It all depends on how the global markets are performing in a month or two.
(CL Chart)

oild

(XOI Chart)

oile

Right now, expect continued price rotation between $42 ppb and $28 ppb till shortly after April 5th.  Then expect much larger price rotation till after May 5th.  At that point, we’ll have to see how the global economic factors are playing out to make further price expectations.
I expect there to be some big trades around crude oil for both short term swing trades and long term trend trades but the market just is not yet here.
Learn & Trade With My Daily Video Analysis & Trades, visit www.The Gold & Oil Guy.com

Stock & ETF Trading Signals

Stock Trkr
Mike Seery’s Weekly Futures Recap – Crude Oil, Natural Gas, Gold, Coffee, Sugar

It’s Saturday and that means it is time for a heads up from our trading partner Michael Seery. We’ve asked him to give our readers a recap of the this weeks futures markets and give us some insight on where he sees these markets headed. Mike has been a senior analyst for close to 15 years and has extensive knowledge of all of the commodity and option markets. 

Crude oil futures in the April contract settled last Friday in New York at 38.50 a barrel while currently trading 40.65 up over $2 for the trading week now trading above its 20 and 100 day moving average for the first time in 6 months. The selloff in the U.S dollar has pushed up oil prices tremendously over the last several weeks. Oil prices are trading higher for the 3rd consecutive day; however this rally has been based on very low volume which is a little concerning as I’m sitting on the sidelines in this market as I have missed the rally to the upside. The U.S dollar has hit a 6 month low and that has propped up many commodity prices and especially crude oil as gasoline and heating oil also have rallied substantially. You will notice this at your local gas station as you are paying much more than you were just three or four weeks ago as the tide has turned in the commodity markets. Rumors are circulating that Saudi Arabia is going to urge OPEC to start cutting production, therefore, pushing up prices even higher as their economy is struggling due to low prices. However, the chart structure is poor and sometimes you miss trades as this did not meet criteria to enter into and that’s exactly what happened to me, as I am leery of this market in 42/45 level as I assume production will come back onto the table because of higher prices.
TREND: HIGHER
CHART STRUCTURE: POOR

He has been killing it in 2016, get Chris “the Gold & Oil Guy” Vermeulen’s Trading Forecasts & Trade Signals Today

Natural gas futures in the April contract is now trading above its 20 day, but still below its 100 day moving average settling last Friday in New York at 182 while currently trading at 194. I was recommending a short position getting stopped out earlier in the week as now I’m currently sitting on the sidelines. Natural gas prices are trading at a 4 week high. However, the chart structure is poor meaning that the 10 day low it’s too far away to meet my criteria to enter into a new trade so keep a close eye on this market as we could get involved to the upside soon. The fundamentals remain bearish. However, that has already been reflected in the price as supplies are huge at the present time, but the bearish short term trend has ended in my opinion. The energy sector has caught fire over the last several weeks as crude oil is now trading at 42 a barrel which has also supported gas prices in the short term, but look at other markets that are beginning to trend with higher potential.
TREND: MIXED
CHART STRUCTURE: POOR

Gold futures in the April contract settled last Friday in New York at 1,259 an ounce while currently trading at 1,254 down slightly for the trading week in a very highly volatile trading manner as prices reacted sharply to the upside off of the Federal Reserve statement of not raising interest rates sending prices up over $40 in Thursday’s trade. At the current time, I’m sitting on the sidelines in this market as I have missed the upside. However, I am not bullish gold at this price level as I think prices are topping out. However I’m not recommending a short position, but if you believe my opinion, I would sell a mini contract while placing the stop loss above the most recent high of 1,287 risking $30 or $1,000 per mini contract plus slippage and commission. Negative interest rates throughout the world have spooked investors back into the gold market as commodities, in general, have rallied as a whole. However, I remain bullish the stock market which continues to move higher as I think money flows will come out of the precious metals here in the short term. Remember when trading commodities it’s all based on risk as the risk/reward on the short side I think is in your favor, but it does not meet my criteria for an official entry into a new trade which has to be a 4 week low, but decide for yourself what’s best for your trading account.
TREND: HIGHER
CHART STRUCTURE: POOR

Check out Adam’s Hewison’s “World Cup Portfolio”

Coffee futures in the May contract settled last Friday in New York at 125.80 a pound while currently trading at 134.50 trading higher for the 3rd consecutive trading session up around 900 points for the trading week hitting a 5 month high. I’ve been recommending a bullish position from around the 121.50 level and if you took that trade continue to place your stop loss below the 10 day low which currently stands at 119 as the chart structure is terrible at the present time due to the fact that coffee prices have exploded to the upside over the last week. The commodity markets, in general, have rallied substantially due to the fact that the U.S dollar has hit a 6 month low and it certainly looks to me that the bear markets are over with in the short term. However, if you have missed this trade the risk/reward is not your favor at the current time as you missed the boat so you must look at other markets that are beginning to trend. The next major level of resistance is the October high around 142 as I think prices could test that level next week as coffee prices are still cheap in my opinion as demand currently is strong. At the current time, I’m recommending a bullish position in cocoa and coffee as the soft commodity markets have certainly caught fire recently including the sugar market so start looking at the commodities to the upside.
TREND: HIGHER
CHART STRUCTURE: POOR

Sugar futures in the May contract settled last Friday in New York at 15.13 a pound while currently trading at 15.86 continuing its remarkable bullish run to the upside hitting a 14 month high as I’m sitting on the sidelines as the chart structure has not met my criteria towards entering into the trade. However, I’m certainly not recommending any type of short position as it looks to me that prices are headed even higher. Sugar futures are trading above their 20 and 100 day moving average telling you that the short term trend is to the upside as the commodity markets have caught fire as who knows how high sugar prices can actually go as production cuts throughout major growing regions throughout the world are causing concerns about carryover levels pushing prices up tremendously over the last 3 weeks. Remember when you trade commodities the trend is your friend and trading with the path of least resistance is the most successful way to trade in my opinion over the course of time so do not sell sugar at this point, but if you have missed this trade sit on the sidelines and look at other markets that are beginning to trend as the horse has left the barn in this market in the short term.
TREND: HIGHER
CHART STRUCTURE: POOR

Get more of Mike Seerys call on commodities this week….Just Visit Here

Get our latest FREE eBook “Understanding Options”….Just Click Here!

Stock & ETF Trading Signals

Stock Trkr
Gold and Oil Are Soaring…Justin says There is Only One You Should Buy

By Justin Spittler

Gold had a HUGE day yesterday. The price of gold jumped 2.5% to $1,263/oz. Gold is this year’s top performing asset. With a 19% gain since January, it’s off to its best start to a year since 1974, according to Bloomberg Business.

Casey Research founder Doug Casey thinks this is just the beginning…..
In case you missed it yesterday, Doug explained why gold is set to rise at least 200%…and possibly even 400% or 500%. It’s a “must-read” essay, especially if you’re worried about the fragile stock market, slowing economy, or reckless governments.

In short, Doug believes the government has set us up for a crisis that “will in many ways dwarf the Great Depression.” And Doug expects the coming economic disaster to ignite a historic gold bull market.

When people wake up and realize that most banks and governments are bankrupt, they’ll flock to gold…just as they’ve done for centuries. Gold will rise multiples of its current value. I expect a 200% rise from current levels, at the minimum. There are many reasons, which we don’t have room to cover here, why gold could see a 400% or 500% gain.

Gold stocks will soar even higher…..
Longtime readers know gold stocks offer leverage to the price of gold. A 200% jump in the price of gold could cause gold stocks to spike 400%…600%…or more. The Market Vectors Gold Miners ETF (GDX), which tracks large gold miners, has soared 52% this year. Yesterday, it closed at its highest level since February 2015.

But gold stocks are still extremely cheap..…
Doug is loading up on gold stocks right now.

Right now gold stocks are near a historic low. I’m buying them aggressively. At this point, it’s possible that the shares of a quality exploration company or a quality development company (i.e., one that has found a deposit and is advancing it toward production) could still go down 10, 20, 30, or even 50 percent. But there’s an excellent chance that the same stock will go up by 10, 50, or even 100 times.

If you’re interested in multiplying your money by 5x or 10x in the coming gold “mania,” now is the time to take a position in gold stocks. The window of opportunity won’t stay open long. As Doug said, gold stocks will skyrocket once people realize the financial system is doomed. Because this window of opportunity is small, we’re currently running a special $500 discount on our service that recommends gold stocks, International Speculator. Click here to learn more.

Crude Oil is also soaring…..
As Dispatch readers know, there’s been nothing but bad news in the oil sector for nearly two years. The price of oil crashed 75%. Two months ago, it hit its lowest price since 2003. But since then, oil has climbed 36%. It jumped 5.1% yesterday. Why the big reversal? We’ll get to that in a second. First, let’s recap the recent disaster in the oil industry.

The world has too much oil…..
From 1998 to 2008, the price of oil surged more than 1,200%. Last year, U.S. oil production surged to the highest level since the 1970s. Global output also reached record highs. High prices encouraged innovation. Oil companies developed new methods, like “fracking.” This unlocked billions of barrels of oil that were once impossible to extract from shale regions. Today, the global economy produces more oil than it consumes. Each day, oil companies produce about 1.9 million more barrels than the world needs.

Crude Oil companies have slashed spending to cope with low prices…..
They’ve sold assets, abandoned billion dollar projects, cut their dividends and laid off more than 250,000 workers since June 2014. According to investment bank Barclays, oil and gas producers cut spending by 23% last year. Barclays expects spending to fall another 15% in 2016. This would be the first time in two decades the industry has cut spending two years in a row. Last week, the number of U.S. rigs actively pumping oil and natural gas plummeted to its lowest level in 70 years.

With oil prices rising, many U.S. companies can’t bring rigs back online fast enough…..
They don’t have enough workers or equipment after all the spending cuts. The Wall Street Journal reports:

Some of the largest U.S. oilfield services firms have laid off 110,000 people in the past year, Evercore ISI analysts estimate, and many of those workers have no plans to return to the industry.
Close to 60% of the fracking equipment in the U.S. has been idled during the downturn, according to IHS Energy, which estimates it would take two months for some of that equipment to return.

The Wall Street Journal continues:

Still, even if prices return to levels where shale drillers can make money again, many companies are vowing to be cautious. Some are tempered by what occurred last spring, when producers jumped back into drilling new wells after oil prices briefly hit $60 a barrel, inadvertently worsening a supply glut that ultimately made prices worse.

This is a dramatic shift in thinking by the industry…..
Oil companies had been pumping near-record amounts of oil for almost two years, despite low prices. Many companies had no choice. When all your revenue comes from selling oil, you have to keep pumping and selling oil. Companies could either sell oil for cheap or go out of business.

With fewer rigs pumping oil today, oil prices are climbing..…
Still, the oil crisis is far from over. Even with the recent rally, the price of oil is 65% below its 2014 high. It’s trading around $38 a barrel. Many companies won’t earn a profit unless oil gets back to $50. According to The Wall Street Journal, one-third of U.S. oil producers could go bankrupt this year. A wave of bankruptcies would likely trigger another leg down in oil stocks.

The oil market is highly cyclical…..
It goes through big booms and busts. Today, the industry is going through its worst bust in decades. It will boom again…but not until the world works off its massive oversupply of oil. According to the International Energy Agency, the oil surplus could last into 2017.

Last month, Saudi Arabia, Russia, Qatar, and Venezuela agreed to cap oil output…..
Saudi Arabia and Russia are two of the world’s three largest oil-producing countries. Qatar and Venezuela are also major oil producers. These countries agreed to “freeze” their oil production at January levels. They quickly broke the agreement. On Monday, CNN Money reported that Saudi Arabia and Russia actually boosted output last month. Both countries are pumping record amounts of oil. They don’t have much choice. Oil makes up 80% of Saudi Arabia’s exports. It accounts for 52% of Russia’s exports.

Nick Giambruno, editor of Crisis Investing, doesn’t think Saudi Arabia will survive the crisis…..

But he says the U.S. shale industry will survive.

By keeping the market saturated with oil, the Saudis are driving down the price. They hope to drive it down low enough and long enough to bankrupt the shale industry…since shale oil costs more than Saudi oil to produce. The U.S. shale industry is a major source of competition.

In the 1990s, the U.S. imported close to 25% of its oil from Saudi Arabia. Today—because of high U.S. shale oil production—the U.S. imports only 5%. The Saudis are having some success. In the past year, at least 67 U.S. oil companies have filed for bankruptcy. Analysts estimate as many as 150 could follow. The shale oil industry is in ‘survival mode.’

The Saudis have damaged the U.S. shale oil industry. And they’ll continue to cause more damage. But they won’t bankrupt every producer. The shale industry has more staying power than Saudi Arabia. Some producers now say they’re profitable with $40 oil. And their pace of innovation will drive that even lower. The industry will survive.

The Saudis are playing a dangerous game.

If the Saudis don’t stop flooding the market—and there are no signs they will—they won’t be shooting themselves in the foot…but in the head. Saudi Arabia will either collapse or surrender—and stop flooding the market. Either way, oil will eventually go a lot higher.

Shale oil stocks are a train wreck right now. Occidental Petroleum Corporation (OXY), the largest shale oil producer, is down 30% since June 2014. EOG Resources Inc. (EOG), the second-largest shale oil producer, is down 35%.

Nick sees huge opportunity here. He often reminds readers that a crisis is the only time you can buy a dollar’s worth of assets for a dime or less. And shale oil stocks are in a major crisis right now. Nick has already picked out a “best of breed” U.S. shale oil company. But before pulling the trigger, Nick is waiting for the Saudi government to show signs of cracking. The point of maximum pessimism will present a “once-in-a-generation opportunity” to pick up this shale company at an absurdly cheap price.

You can get in on this opportunity by signing up for Crisis Investing. Click here to begin your 90-day risk-free trial.
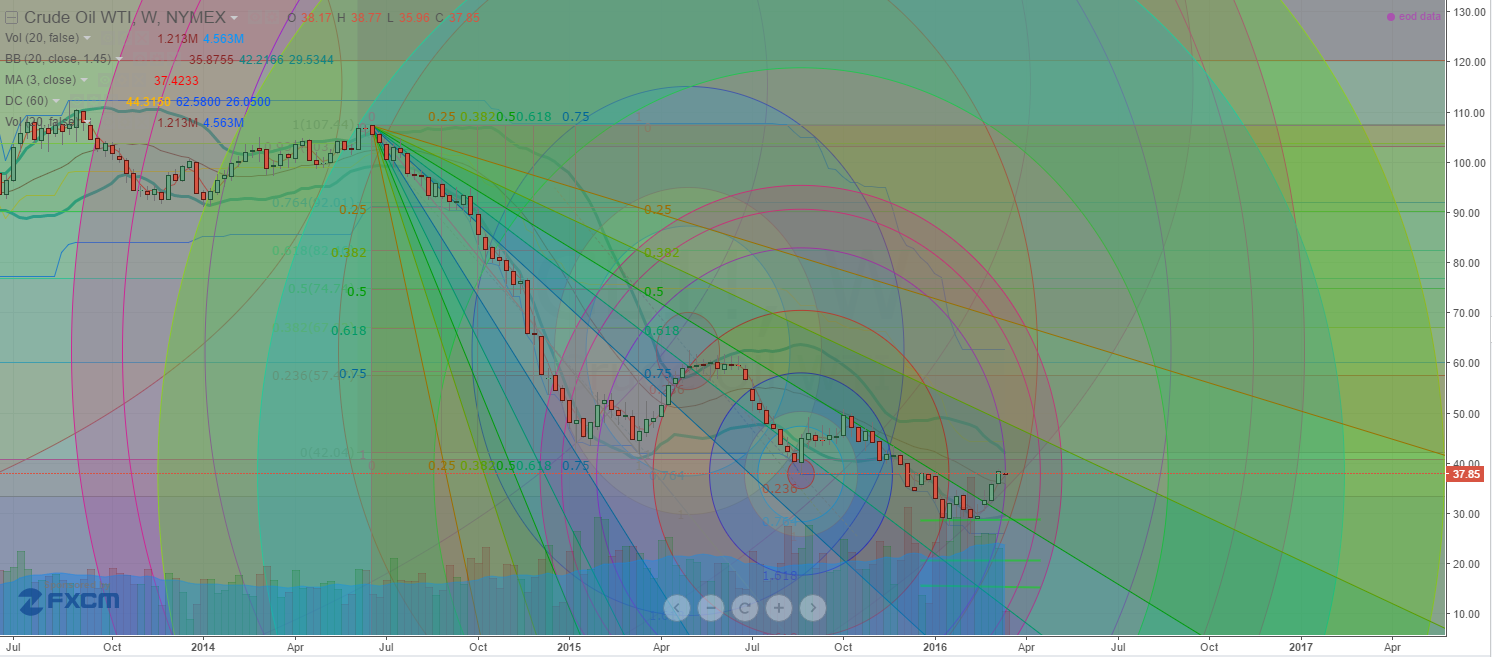
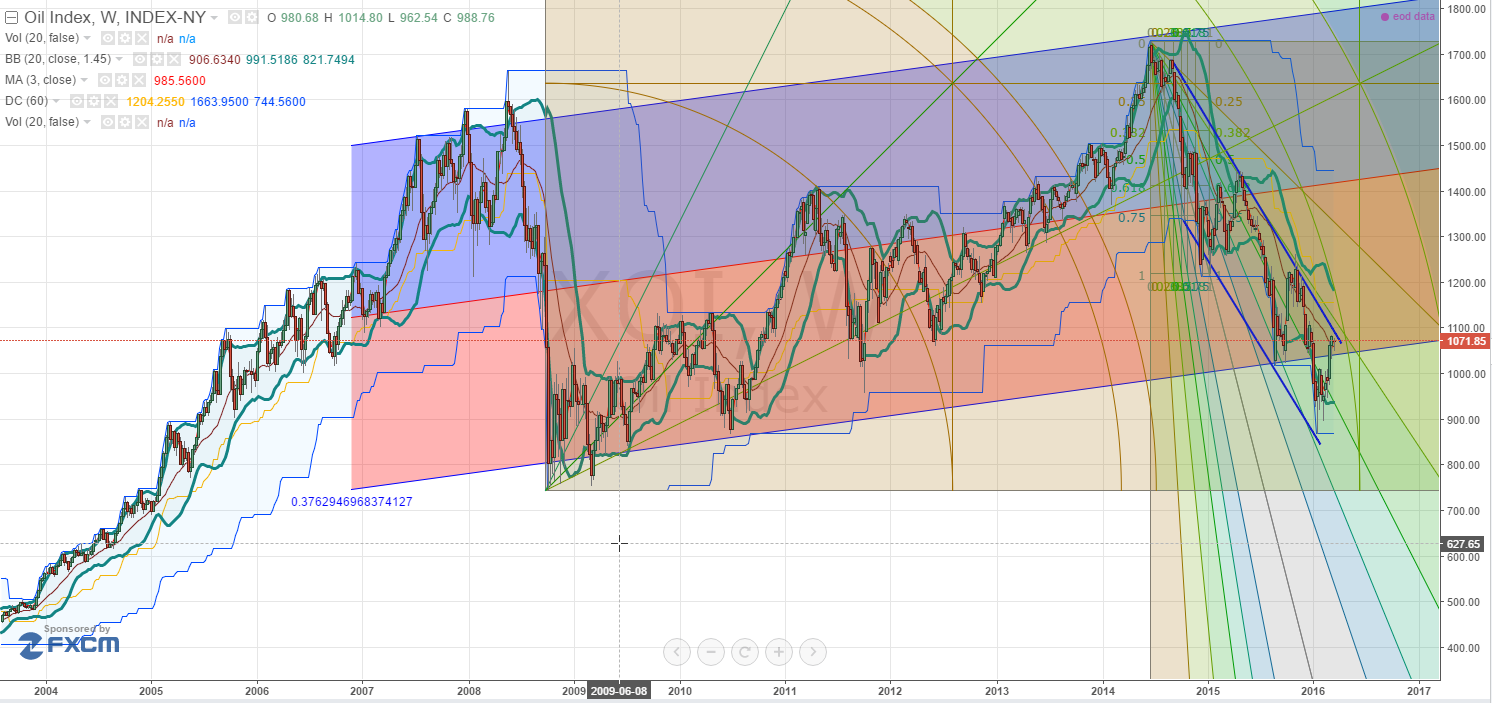
Chart of the Day

Oil is still near its lowest level in years. As we mentioned earlier, oil has rallied 36% over the past few weeks. That’s a big jump in a short period. But oil isn’t in the clear yet.  Today’s chart shows the performance of oil since 2014. You can see that the price of oil is still well below its 2014 high. It’s trading at prices last seen during the last financial crisis. Many oil companies can’t survive with current oil prices. Some will go out of business. And a wave of bankruptcies will likely spark another leg down in oil stocks. We recommend avoiding oil stocks for now.

Get our latest FREE eBook “Understanding Options”….Just Click Here!

Stock & ETF Trading Signals

Stock Trkr