Nevada Mining Special

Nevada is the gold and silver state in the US and well known for great gold production in the last 150 years. Let’s have a look at exciting companies like the producers Klondex and Rye Patch as well as the emerging producer Pershing Gold. Jochen Staiger, CEO & Founder of Swiss Resource Capital AG. You […]

Stock Trkr
EUR/USD And Gold

Reflationary trades have resumed their uptrend, possibly towards end of February, meanwhile EUR/USD and Gold could retest lows. Jean-Francois Owczarczak, Director, FinGraphs.com. You can view this video and the full video archive on the Dukascopy TV page: http://www.dukascopy.com/tv/en/#205057 Смотрите Dukascopy TV на вашем языке: http://www.youtube.com/user/dukascopytvrussian 用您的语言观看杜高斯贝电视: http://www.youtube.com/user/dukascopytvchinese Miren Dukascopy TV en su idioma: http://www.youtube.com/user/dukascopytvspanish Schauen […]

Stock Trkr
Dukascopy: Coppers Slow Recovery

2017 to be a better year for Copper than 2016. Paul Benjamin, Wood Mackenzie. Related Posts:GBP/USD. October 13th. US core inflation continues to slow… October 13, 2023 On the hourly chart, the GBP/USD pair reversed its course…

Stock Trkr
Our Next Technical Price Targets for Gold & Silver
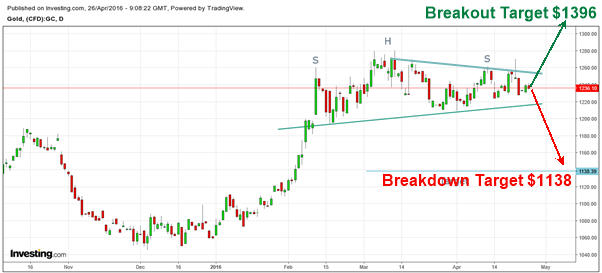
I have pointed out earlier, gold is forming a possible short term top. It is on the verge of completing a bearish ‘Head and Shoulder’ pattern. The pattern is confirmed if gold closes below $1220/oz. The downside pattern target for this setup is $1138/oz. 
If gold starts to rally and breaks out to the upside, then we should see the $1396 level be reached based on technical analysis.
I will open a new long gold position when the time feels right. With technical analysis strongly suggesting gold and silver have bottomed, New breakouts to the upside in metals and mining stocks can be bought.
goldtargets
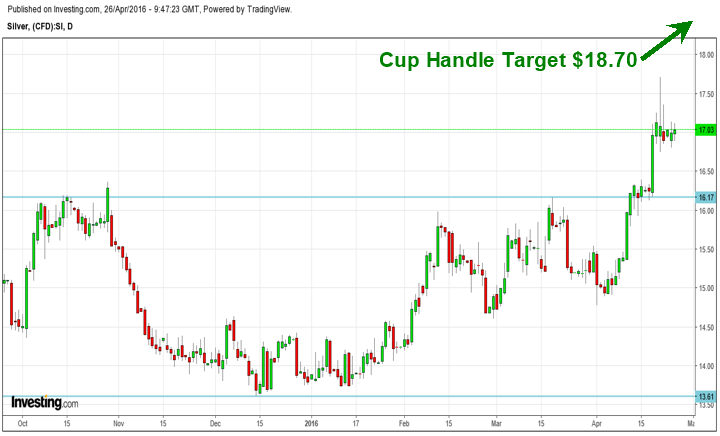
On the other hand, silver has formed an almost perfect cup and handle pattern and has broken out of it. It has reached its first target objective; chances are that silver will either consolidate or pullback after having met its target or move up to $18.70/oz. levels, which is the pattern target of the ‘Cup and Handle’ pattern formation. However, new buying is not advised at current levels due to a poor risk-reward ratio.
If you have not read the post about what the Silver COT data is warning us about be sure to read this short post: Click Here
silvertarget
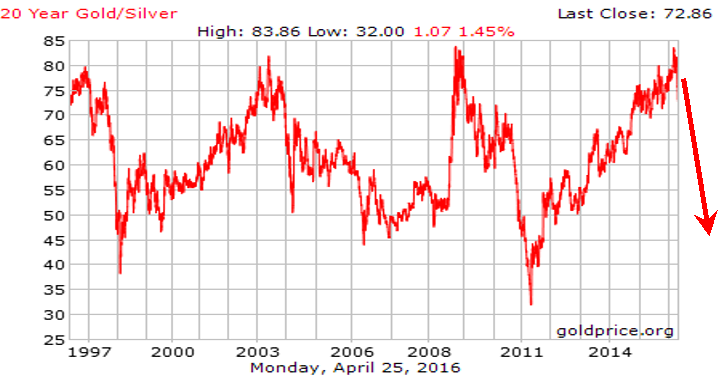
If we take a look and monitor the gold/silver ratio closely, recently, the ratio had touched its resistance of the past 20 years. Every time the ratio has returned from the resistance, the minimum it has retraced is to the levels of 45.
There are no reasons to believe that it will be any different this time around. Hypothetically, if gold were to remain at $1236/oz. and if the ratio corrects to 45, silver will reach $27.5/oz., which is a 62% increase from current levels.
Hence, it is prudent to stay with silver for a better return compared to gold once price has a pause to regroup before the next rally.
ratiotarget
How to Trade Gold & Silver Conclusion:
Buying gold and silver offer different rate of returns to the investors. If an investor is able to time both the precious metals, then the total returns will be ‘astronomically high’ in the future.
My timing ‘cycles’ provide signals both for the short term and the long term. The price action of both gold and silver along with my cycles have been showing VERY strong “Cycle Skew”, which I explain in detail in my book “Technical Trading Mastery”. This cycle skew is telling us that precious metals are now in a strong uptrend and is another confirming indicator that support much higher prices long term.
During the first half of a bull market trading price patterns and upside breakouts tend to work very well. Because interest in the sector is growing and more buyers continue to enter that market, price pattern breakouts are the last chance to get a position before price has its next rally higher.
I will continue to inform my subscribers of new swing trades, and even more importantly the long term investing “Set it and Forget It” ETF trades to ride out the new bull and bear markets for massive profits.
Keep following me to know more at: www.The Gold and Oil Guy.com
Chris Vermeulen

Stock & ETF Trading Signals

Stock Trkr
Massive Surge in Precious Metals and a New Spike Alert
Metals and mining stocks continue to rock higher decoupling from our cycle analysis to create a strong impulse wave higher. This is what I feared last week and talked about happening and is the reason we had our protective stop for our short gold trade so we would keep that trade as a winner. Also, my gut was warning that this cycle break and emotional rally was trying to happen, and that is why we did not re-enter a short position in this sector.
The last two weeks this sector has been moving fairly sporadically and out of sync. Because of this, I have not covered it in much detail. Yesterday Obama announced an unexpected and expedited closed door meeting with the FED for today. I think this may have everyone worried and buying metals today.
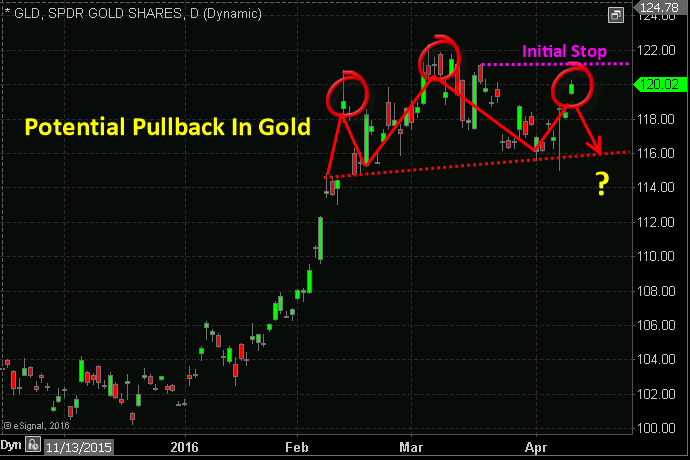
Today’s massive gap and rally actually have me very interested in a short trade for gold. With the chart forming a balance head and shoulders pattern, price trading at resistance, a news/fear based rally, along with a short term cycle topping today, this could be a great low-risk trade and price may fade back down over the next 1-3 days.
See chart below or login to view:
goldshort
Couple things to touch on here:
First, I would like to mention and be clear that while I share some spike alert setups here and there with you, those trades are not the main focus of this newsletter and my trading. This year the way the markets have been gyrating spike trades have definitely filled the void for a lack of swing trades and long term investment positions.
We will sooner than later start building some new long term positions and have swing trades. But it is difficult because so many markets are all trying to change directions and chopping around. I don’t want us holding onto trades that will be all over the place for several weeks before moving in our favor. We don’t need that stress. Rather, I’m trying to hold off as long as I can before getting positioned. Don’t worry, they are coming!
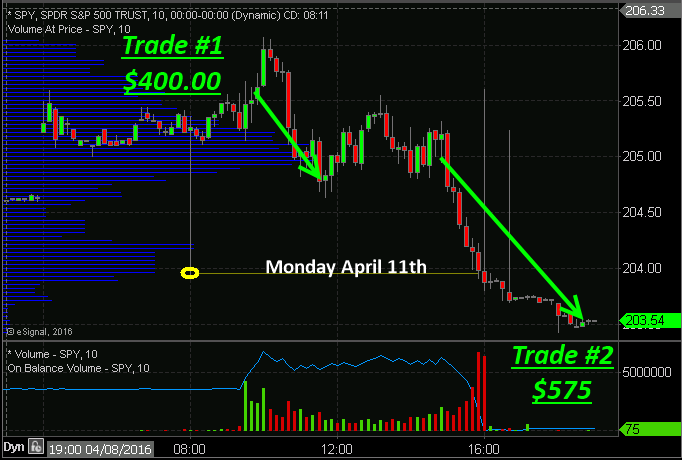
Second, I know many of you love the price spikes as they provide a steady stream of winning trades each week. Friday morning was a quick $900 profit, and this morning in the video I shared with you the SPY price spike that took place in pre market today. I traded it also for a quick day trade pocketing $400.00 in less than 1 hour to kick start the week.
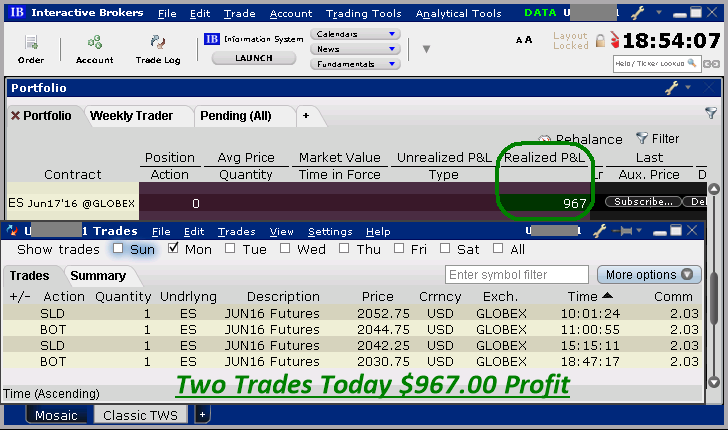
You can see my trade today with my Interactive Brokers account. I waited to enter this trade until I felt the market shook out the short positions and got everyone bullish for the day. Then I sold short 1 the ES mini futures contract at 10:01am.
I have explained the market shakeout move before. How we see a price spike and the market, but the price will first move in the opposite direction to get everyone on the wrong side of the trade before it makes its move to reach the spike target.
Then 59 minutes later at 11:00am I bought back my short position and locked in 8 points ($50 per point x 8 = $400). Then another short position in the afternoon as the market started to breakdown again to fill the morning spike for another 11.5 points ($50 per point x $11.5 = $575).
spiketargets
Just these three trades you were able to pocket $1,8670.00 which is more than enough to cover 4 years of me sharing analysis and trades with you… not too shabby!
I will be creating a mini course/guide on how to trade Spike Alerts soon because there is an art to doing it well. Plus, I am working on a solution so those of you who want to keep rocking with the price spikes can do so without me bombarding every member with all this day trading/momentum analysis and updates.
I totally understand and feel for those who just want long term and swing trades and not intraday updates all the time. So, I’m working to satisfy both groups.

Get Chris’ Swing Trading and Long Term Investing Signals….Just Click Here!


Stock & ETF Trading Signals

Stock Trkr
Don Kaufman shows us how to "Protect & Profit" in any Market

Today we want to introduce the newest member of our team, Don Kaufman. Don has made quite a mark in the last couple months with the introduction of his new TheoTrade program. Truth is, some of our readers have stated they are getting more from his free videos then some of the more expensive programs they have purchased.

Don will be bringing us a free webinar monthly to keep us on the cutting edge of these extremely volatile markets. Just take advantage of any one of his free items. Getting his free eBook or even just watching his most recent free video will guarantee that you will get notified of the free webinars.

So what’s in the “How to Protect & Profit in Any Market” eBook?

This 50 page eBook [visit here for free download] will teach you what you need to know to start playing the markets instead of the markets playing you.

Your Portfolio Deserves More Than a 50/50 Chance 
It has been shown statistically, over the long run, that fundamental and technical analysis is right about 50% of the time. Flipping a coin will give you the same percentage. As the author of A Random Walk Down Wall Street, Malkiel states, “Technical and Fundamental analysis is a science giving astrology a good name.” Why flip a coin when you can use high probability options strategies?

Diversification is Dead
As a Wall Street saying goes, “When they raid the house they take everyone.” Professionals consider diversification as a hedge for people who don’t know how to hedge. Think about it – would you protect the value of your own home against a potential fire by diversifying, that is, buying two houses so if one burns down, the appreciation in the other offsets your loss? Of course not! You insure your home so if it burns down, the insurance covers most of the loss. Welcome to one aspect of using options. Real professionals know how to use options to protect their portfolio from any shock to the markets.

Be The House 
Today, investing in the stock market is a big gamble, almost like going to Vegas and playing the slots. And we all know what happens with slot machines. The House always wins. It may take a loss occasionally, but the overall strategy assures that the House will always come out on top. Options let’s you turn the tide and be the house. Find out how you can put the odds in your favor.

Get Don’s FREE eBook “The Rebel’s Guide to Trading Options”….Just Visit Here!

See you in the markets,
Ray C. Parrish
aka the Crude Oil Trader

About Don Kaufman 
Don is one of the industry’s leading financial strategists and educational authorities with 18 years of financial industry experience. Prior to co-founding TheoTrade, Mr. Kaufman spent 6 years at TD Ameritrade as Director of the Trader Group. At TD Ameritrade Mr. Kaufman handled thinkorswim® content and client education which included the design, build, and execution of what has become the industry standard in financial education. He started his career at thinkorswim® in 2000 (acquired by TD Ameritrade in 2009), where he served as chief derivatives instructor, helping the firm progress into the industry leader in retail options trading and investor education services.

Stock Trkr
Believe It or Not, It’s Happening to Gold

Last night as I was going over my charts and running my end of the day analysis the charts jumped out at me with a trade setup and wanted to share my cycle chart for gold with you. The price chart of gold below is exactly what my cycle analysis told us to look for last week WELL ahead of the today’s news and its things play out I as I feel they will then we stand to make some pretty good money as gold falls in value during the month of April.

If you have been following my work for any length of time then you know big price movements in the market like today (Tuesday, March 29th) based around the FED news ARE NOT and SHOULD NOT be of any surprise. In fact, this charts told use about today’s pop 2 weeks ago and we have been waiting for it ever since. The news is simply the best way to get the masses on board with market moves and gets them on the wrong side of the market before it makes a big move in the other direction, most times… not always, though.

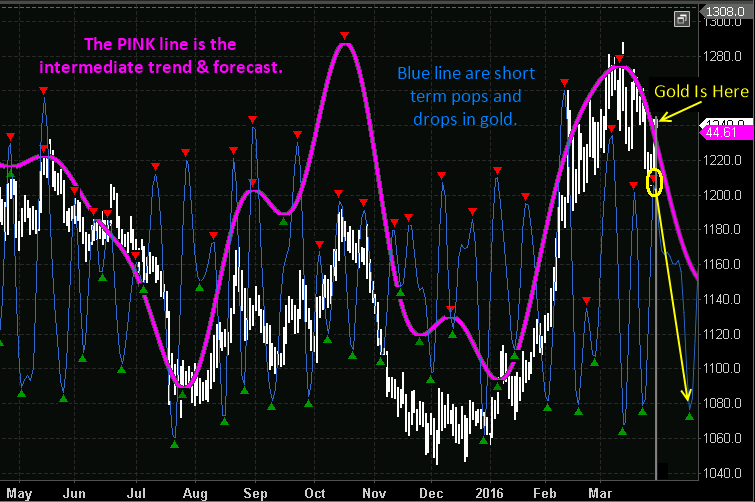
Take a look at this chart below. You’ll see two cycle indicators, one pink and one blue. The pink cycle line is a cluster of various cycles blended together which allows us to view the overall market trend of biased looking forward 5 – 30 days. The blue cycle line is a cluster of much shorter time frame cycles in this tells us when we should expect strong moves in the same direction of the pink cycles or counter trend pullbacks within the trend.

One quick point to note with cycle trading is that the height and depth of the cycle does not mean the price will rise or fall to those levels, it simply tells us if the market has an upward or downward bias. The current cycle analysis for gold along with the current price is telling us that today the short term cycle topped which is the blue line and our main trend cycle is already heading lower. The odds favor gold should roll over and make new multi-month Lows in August.

gold-collapse

In short, we have been waiting for gold to have a technical breakdown and to retrace back up into a short term overbought condition. Today Tuesday, March 29 it looks as though we finally have the setup. Over the next 5 to 15 days I expect gold to drop along with silver and gold stocks. There are many ways to play this through inverse exchange traded funds or short selling gold, silver or gold stocks.

This year and 2017 I believe are going to be incredible years for both traders and investors. If treated correctly, it can be a life changing experience financially for some individuals. Join my pre-market video newsletter and start your day with a hot cup of coffee and my market forecast video.

Sign up right here > www.The Gold & Oil Guy.com

Chris Vermeulen

Stock & ETF Trading Signals

Stock Trkr