Crude Oil and Gas ETFs are Having a Good 2018

Thus far in 2018, the oil and gas industry has been booming. Rig counts in the US are up, prices at the pump are up, and the oil and gas ETFs tracking the sector are up by a lot.

Investors who have been following the industry over the past year could have made some serious money as a few of the leveraged ETFs are up 238% or more. The Velocity Shares 3X Long Crude Oil ETN (UWT) is up 247% over the last 12 months and is up more than 70% year to date. The UBS ETRACS ProShares Daily 3X Long Crude ETN (WTIU) has risen 240% over the last year and 64% year to date. Finally, the Proshares UltraPro 3X Crude Oil ETF (OILU) is up 238% over the last 12 months and 63% year to date.

But, perhaps your less risky and don’t like investing in the leveraged ETFs? Well, you still could have done well as the United States Brent Oil Fund LP (BNO) is up 71% over the last year and 19.9% since the start of 2018. Or perhaps you went with the ProShares K-1 Free Crude Oil Strategy ETF (OILK) which is up 62% in the past 12 months and 23% year to date. Or either the iPath Series B S&P GSCI Crude Oil ETN (OILB) or the United States Oil Fund LP (USO) which are both up more than 61% over the last year and 23% year to date.

There have been some reasons why the industry has been on a tear over the last, and many of that reason don’t show signs of changing in the short term. OPEC is committed to increasing the price of oil (despite its recent modest increase in production), smaller U.S. outfits still need slightly higher prices before they can add additional rigs and become profitable, the economy appears to be healthy and growing, US consumers have not yet begun to fell the “pain at the pump” again really.

While recent data and projections from the U.S. Energy Information Administration don’t indicate massive price increases for oil and gas shortly, they are predicting increases. Speaking of the government, despite President Trump’s promises, he has yet been able to change the shift we saw occur during the later Obama years when electric plants switched to natural gas from coal. This is something that really could change the oil and gas landscape in coming years if natural begin to climb naturally. Depending on which resource, oil or natural gas is more profitable, U.S. producers could flip-flop from one to another, causing the prices of both to climb. But, this would be something to watch for in a much longer time horizon than what we are discussing today.

Some investors may feel the run in oil and gas has already taken place and that greener pastures should be explored, as opposed to trying to get on a moving train. But, if the economic reasons for the price increases haven’t changed, then prices should theoretically continue to climb until something else changes.

Furthermore, while OPEC and Russia both talk about higher output, the fact of the matter is both parties want the price of oil to either remain where it is or increase. Most of the countries in OPEC need Oil and Gas money in order to run their governments, while it is clear to most, that some high ranking Russian government officials have personal interests in the industry.

Furthermore, the argument could be made that both Russia and OPEC would rather see prices stay flat as opposed to climbing back to $100 a barrel because current prices keep some of the U.S. producers out of business and this gives Russia and OPEC more control on global production and price stability.

But, regardless of why Russia and OPEC may want to prices getting out of control, they still want to maintain current prices, giving oil and gas a reasonably stable price floor.

Buying different oil and gas ETFs, ETNs or other funds may not produce the huge returns we have seen in the past 12 or 7 months, but they could still bear fruit worth eating. The leveraged investments appear to be extremely risky at this time, even though I don’t see prices falling, but simply because of the daily costs associated with these funds. Buying a solid group of oil and gas ETFs made up of both the companies operating in the industry and the commodities themselves could pay healthy dividends in the coming year.

Matt Thalman
INO.com Contributor – ETFs

Stock Trkr
Why Gold Miners Should Rally as U.S. Equities Fall on Fear

The US Equities markets rotated over 1.35% lower on Monday, June 25, after a very eventful weekend full of news and global political concerns. Much of this fear results from unknowns resulting from Europe, Asia, China, Mexico and the US. Currently, there are so many “contagion factors” at play, we don’t know how all of it will eventually play out in the long run.

Europe is in the midst of a moderate political revolt regarding refugee/immigration issues/costs and political turmoil originating from the European Union leadership. How they resolve these issues will likely be counter to the populist demands from the people of Europe.

Asia is in the midst of a political and economic cycle rotation. Malaysia has recently elected Prime Minister Dr. Mahathir Mohamad, the 92 year old previous prime minister (1981-2003) as a populist revolt against the Najib Razak administration. In the process, Mahathir has opened new and old corruption and legal issues while attempting to clean up the corruption and nepotism that has run rampant in Malaysia. Most recently, Mahathir has begun to question the established relationship with Singapore and the high speed rail system that was proposed to link the two countries.

China is experiencing a host of issues at the moment. Trade concerns, capital market concerns, corporate debt concerns and an overall economic downturn cycle that started near the beginning of 2018. What will it take to push China over the edge in terms of a credit/consumer market crash is anyone’s guess? Our assumption is that continued inward and outward pressures will not abate quickly – so more unknowns exist.

Mexico will have new Presidential elections on July 1, 2018. What hangs in the balance of this election cycle is just about everything in terms of North American economic cooperation and future success. It is being reported that a populist “anti-neoliberal” movement is well underway in Mexico and the newly elected leader may begin a broader pushback against President Trump regarding NAFTA, immigration, US corporations operating in Mexico and more. We won’t know the full outcome of this election till well after July 2018.

Meanwhile, back in the USA, our political leaders in Congress and the House of Representatives seem hell bent on opposing everything President Trump and many Americans seem to want – clean up the mess in our government and get a handle on the pressing issues before us. The U.S. has a growing and robust economy. The last thing anyone wants right now is anything to disrupt this growth. Yet, it seems the political divide in the U.S. is so strong that it may take some crisis event to push any resolution forward.

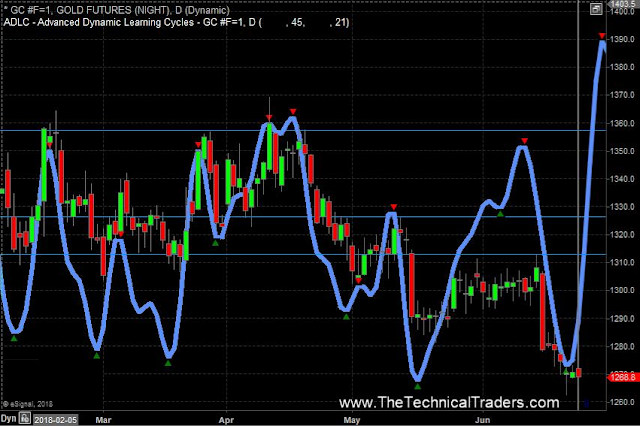
What does this mean for investors and traders? Fear typically appears in one place before it appears anywhere else – the Metals markets (Gold, Silver, Platinum, and Palladium). This Daily Gold Chart shows our predictive cycle analysis pointing to a near term bottom formation as well as a strong likelihood of immediate upside price action. These cycles do not represent price levels. So the cycle peak does not represent where price will go – it simply indicates future cycle trends and direction.

Given this information, it is very likely that Gold will recover to near 1320 within the next couple weeks and possibly push higher on global concerns. For traders, this means we are sitting near an ultimate bottom in the metals and this could be an excellent buying opportunity.

The Gold Miners ETF shows a similar cycle pattern but notice how prices in the Miners ETF have diverged from the Gold chart, above, by not resorting to a new price low as deep as seen above. This could be interpreted as the Gold market reacting to global concerns in an exaggerated way while the miners ETF is showing a more muted reaction. Additionally, notice how the ADL cycle analysis is pointing to similar price peaks in the future with near term bottoms forming. This is key to understanding what we should be expecting over the next few weeks in Gold.

Our interpretation is that the global fear will manifest as a renewed upside trend in Gold and Gold Miners over the next few weeks with the potential for a 5 to 8% rally in Gold. The long term upside is incredible for these trades but that is if you look years into the future.

As these fear components and unknowns continue to evolve, the metals markets should find support and push higher as fear continues to manifest and global markets continue to weaken.

As we have been stating since the beginning of this year, 2018 is setting up to be a trader’s dream. Bigger volatility. Bigger swings. Bigger profits if you are on the right side of these moves. Our proprietary predictive modeling systems and price analysis tools help us to stay ahead of the markets.

We help our members understand the risks and navigate the future trends by issuing research posts, providing Daily video analysis complete with cycle projections and by delivering clear trading signals that assist all of our members in finding profits each year. We are showing you one of our proprietary tools right now, our ADL Predictive Cycle tool and what we believe will be the start of a potential upside move in the metals markets.

 Get ready for some great trading over the next few months!

Stock & ETF Trading Signals

Stock Trkr
Natural Gas Setup for 32% Move Using UGAZ Fund

As we all know a picture says 1000 words, which is one of the reasons why I gravitated to trading using technical analysis. I can look at a chart and in seconds understand what price has done and is likely to do in the near future, without knowing a single thing about the company, index, or commodity. Why spend time reading news, financial statements, and other opinions when you can fast track the entire process with a chart.

So, let’s just jump into the 30 minute chart of natural gas which shows the regular trading hours 9:30am – 4pm ET.

Natural Gas 30 Minute Chart with Oversold and Trend Analysis

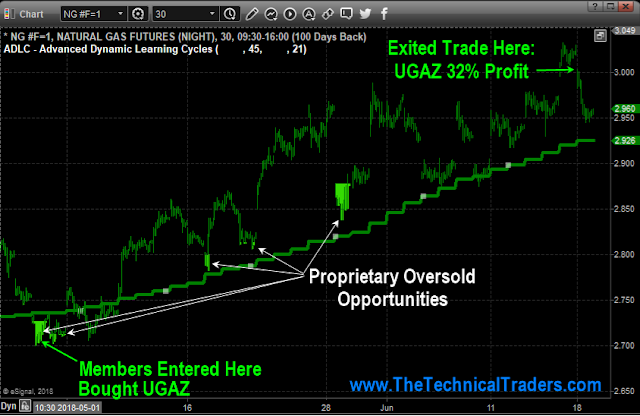
This chart could not be any more simple. Green bars and green line mean price is in an uptrend and you should only look to buy oversold dips. We got long a 3x natural gas ETN on May 3rd right near the dead low. After a few weeks, price action and longer term charts started to signal potential weakness, so we closed out the position for a simple 32% profit.

UGAZ 3X Leveraged Natural Gas Fund
Here is 240 minute (4 hour) candlestick chart of the natural gas fund.

53 years experience in researching and trading makes analyzing the complex and ever changing financial markets a natural process. We have a simple and highly effective way to provide our customers with the most convenient, accurate, and timely market forecasts available today. Our stock and ETF trading alerts are readily available through our exclusive membership service via email and SMS text.

Our newsletter, Technical Trading Mastery book, and 3 Hour Trading Video Course are designed for both traders and investors. Also, some of our strategies have been fully automated for the ultimate trading experience.

See you in the markets!
Chris Vermeulen

Stock & ETF Trading Signals

Stock Trkr
Here’s Why We See the G7, Central Banks and U.S. Fed Will Drive Stock Prices this Week

After last weeks closing bell for stocks and the early signs of the Capital Market Shift which we mentioned previously was taking place are now clearly evident. We wanted to alert all of our followers that this week could be very dramatic with a number of key events playing into global expectations.

Our research team at Technical Traders Ltd. have been combing through the charts trying to find hints of what may happen and what to expect in terms of price volatility next week. We know our ADL price modeling system is telling us that certain price weakness will continue in certain sectors and strength in others – but we are searching for the next opportunities for great trades.

One of the key elements of the G7 meeting is the continued communication regarding global participation in key infrastructure projects and national cooperation in regards to economic stability.

Over the past 8+ years, the bulk of the global recovery has been based on the US economic stability and recovery. US interest rates allowed for a global “carry trade” that supported a large component of the economic bias in foreign countries. Additionally, the deeply discounted U.S. bonds provided a “fire sale” opportunity for many countries to secure U.S. Treasuries at a time when global central banks were printing cash to support failing economies. Overall, the economic conditions from 2009 to 2015 were such that every opportunity was provided to the global markets to make it easier to attempt a proper recovery.

Some nations were able to capitalize on this environment while others squandered the opportunity to create future growth, capabilities and new opportunities for success. Given the current global market environment, we expect some harsh comments to come from the G7 meeting as well as some wishful thinking comments. Overall, we believe the outcome of the G7 meeting will become a defining moment for the remainder of the year in terms of global economic expectations and forward intent. It will certainly be interesting to see how these leaders decide to operate within the constructs of the ever changing global market liabilities to say the least.

Right now, a lot of concern has been directed towards the Emerging Markets and what appears to be a near term market collapse. Debt spreads and global indexes have been moving in a pattern that clearly illustrates the Central Banks problems in containing the diverse economic conditions throughout the globe. Infrastructure projects, social/political shifts and currency valuations are complicating matters by creating extended pressures in many global economies recently. All of this centers around the strength of the U.S. economy and the US dollar as related to expectations and valuations of other foreign economies and currencies.

Almost like a double edged sword, as the U.S. economy/dollar continues to strengthen, foreign capital will migrate into these US assets because of the inherent protection and gains provided by the strength and growth of these markets. While at the same time, the exodus of capital from these foreign markets create a vacuum of value/capability that results in a continued decline in asset valuations and more.

Almost like the 1994 Asian Currency Crisis, the more the US economy strengthens, the more pressures the global markets feel as valuations and assets become more risky to investors. As investors flee this risk, they search for safe returns and value that is found in the US economy/Dollar – driving US equities higher and strengthening the US Dollar. It is a cycle that will likely continue until some equilibrium point is reached in the future.

The US markets are on a terror rally because global capital is searching and seeking the greatest returns possible – and the only place on the planet, right now, that is offering this type of return is the US economy and the US equities market. Our recent research shows that the NASDAQ indexes may stall and rotate over the next few months as price valuations have accelerated quite far and because the blue chips are relatively undervalued at the moment. This means, capital will likely continue to pour into the S&P and DOW heavyweights as this capital shift continues to play out.

The G7 meeting, in Toronto, this week will likely present some interesting outcomes. Early talk is that the G6 nations (minus the US) may enact some deal that they believe would be suitable for these nations going forward. Our concern is not the deal or the threat of these nations trying to engage in some deal without the US – far from it. Our concern is that their wishes may be grandiose and ill timed given these currency and valuation issues.

Imagine, for a second, the G6 nations engage in some grand scheme to engage in something to spite the USA. Some plan that seems big and bold and over the top. Yet, 5 months from now, debt issues plague these nations, currency valuations have destroyed any advantage they may have perceived they had and the member nations are beginning to feel the pressures of their own entrapment. What then? The USA to the rescue….again?

Recently, Ben Bernanke, a Senior Fellow at The Brookings Institute, warned that Donald Trump’s economy was like a Wile E. Coyote going over a cliff. Everything seems well and fine till the road ends and the cliff begins. I would like to remind all of our readers that The Brookings Institute does not have a stellar record of predicting much of anything over the past 10+ years. Take a look at this graph showing the economic expectations and predictions from The Brookings Institute over the past decade or so. Do these people seem capable of accurately predicting anything regarding the U.S. or global economy?

Now, ignoring all of the what if scenarios that are being presented by different people. The bottom line is that the next 6+ months are going to be very exciting for traders and investors. There are huge issues that are unfolding in the global economy right now. Currency levels are about to be shaken even further and the G6 nations, by the time they complete their high priced dinners and evening events, will walk out of the G7 meeting staring down a greater global debt/currency/economic beast of their own creation.

SE Asia is in the process or rewriting and resolving issues of the past 10+ years (see Malaysia / Singapore).

China is in the midst of a massive debt cycle that is about to play out over the next 18+ months (totaling about 1.8 Trillion Yuan).

The Brasil Bovespa Index has rotated into new BEARISH territory.

The Mexican iShares (EWW) ETF is about to break multi-year lows.

The Hang Seng Index is setting up a possible topping pattern that could break down given state and corporate debt concerns.

The iShares Turkey (EURONEXT) index has already broken to new multi-year lows.

The G6 better have some rabbits in their hats that they can magically transform into big bullish projects over the next 12 months or the economic functions that are at play in the world already are likely to steamroll over the top of any news that originates from the G7 meeting.

The U.S. markets are setup for a continued bullish rally with a bit of Summer capital shifts. Our recent research called the rotation out of the tech heavy NASDAQ and a renewed capital shift into the S&P and the DOW leaders. This rotation is likely to continue for many weeks or months as global investors realize the earnings capabilities and dividends values within the U.S. blue chips are of far greater long term value than the risks associated with technology and bio-tech firms. Because of this, we believe the S&P and DOW/Transports are setting up for a massive price rally to break recent all time market highs.

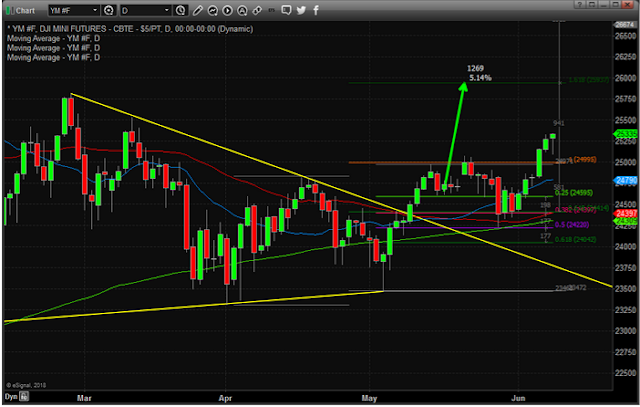
Here is a Daily chart of the YM futures contract showing the recent price breakout and rally. Our expectation is that 26,000 will be breached within 30 days or so and that a large capital shift will drive a continued advance through the end of 2018 – possibly further.

Here is a Daily $TRANS chart showing a similar bullish move. Although the Transportation Index has not broken to new highs yet, we believe this upside move is just beginning and we believe the continued improvements in the US economy will drive the Transportation index to near 11,450 or higher before the end of this year.

Our opinion continues to support the hypothesis that the US markets are the only game on the planet (at the moment) and that a great capital shift is underway in terms of investment in, purchases of and generally opportunistic investment opportunities for US equities and markets going forward. Until something changes where the US dollar strength, foreign economic weakness and foreign debt cycles are abated or resolved, we believe the great capital shift that we have been warning of will continue which will put continued pressures on certain foreign markets and expand debt burdens of at risk nations over time.

Smart traders will be able to identify these opportunities and capitalize on them. They will see this shift taking place and take advantage of the opportunities that arise for quick and easy profits. If you like our research and our understanding of the global markets, be sure to join our premium research and Trade Alert Wealth Building Newsletter. Our valued members stay with us because we have continually proven to be ahead of nearly every market move this year – in many cases many months ahead of the global markets. So, with all of this playing out over the next 6+ months, we suggest you consider joining The Technical Traders to learn how we can help to keep you out of trouble and ahead of the markets for greater success.

Stock & ETF Trading Signals

Stock Trkr
These Three Key Elements Will Drive Stocks Higher Into Year End

Last week was a roller coaster ride for traders and investors. After a long holiday weekend, traders were greeted with concerns originating in Italy regarding political stability and the potential that any further issues could result in a collapse of the EU. Even though the risk of this happening was somewhat minor, the US markets tanked near 2% as fear seemed to override common sense. The rest of this week has been a wild ride of price rotation within a range. We’ve been reading all types of news and comments regarding all types of “what if” scenarios from analysts and researchers while scratching our heads at some of the comments.

As we stated in our earlier article regarding the Italy political crisis [read it here], the one important aspect to trading and investing is to not lose focus on the true perspective and true market fundamentals. Yes, if you are an intraday trader, these wild price swings can either be great profits or wild losses as you try to swing with these rotational moves. As a swing traders/investor, though, we care about the overall stability and direction of the markets. We are willing to ride out some rotation as long as our core analysis is sound and the technical and fundamental basis of our trades is still in place.

In our opinion, there are three things that are core elements of our analysis at the moment and these three things are likely driving the economic future of the US equity markets.

The US Dollar continues to strengthen as the US economy shows solid signs of a broad based economic increase. Oil/Energy prices have continued to decline recently, now down nearly 10% from the recent peak, and this decrease relates to supply and demand expectations throughout the end of this year (roughly 4 – 6 months into the future). The Transportation Index is pushing higher as stronger economic activity is expected throughout the rest of 2018 and into 2019.

These Three Key Elements Cross-Populate as Follows

1.  The strong US dollar is acting like a magnet for foreign capital investment as the strength of the US dollar in combination with the strength of the US economy/equities markets creates a triple-whammy for foreign capital investments. Not only are foreign investors trying to avoid capital devaluation (currency price devaluation) and debt risks in their own local markets, they are trying to find ways to achieve ROI and stability for their capital investments. With almost nowhere else to go, the US equities markets and debt markets are pretty much the only place on the planet for this triple-whammy opportunity.

2.  The strong US jobs numbers and robust economic activity, in combination with the past capital market stimulus and lowered interest rates, are creating a fuel heavy economic environment in the US not that President Trump’s deregulation and policies have injected the Oxygen needed to create the “economic combustion” that is driving this current growth. Energy prices are moderate and dropping as a result of the shift in technologies attributed to electric and hybrid transportation enterprises. All of this, jobs growth, earning growth, economic growth, moderately low interest rates and a true combusting economy, provides for much greater opportunities for an advancing US equities market.

3.  The US equities markets are rotating higher throughout the global weakness and debt concerns while the Transportation index pushes higher as a sign that US investors expect the US economy to continue to grow. Transportations lead the us equities markets by about 4 to 6 months (on average). Lower oil prices, strong jobs numbers, dynamic opportunities in the US economy and a stronger US dollar drive continued US and foreign investments into the US equities markets and debt markets.

As we have stated in earlier research posts regarding “capital migration”, capital (cash) is always seeking the best environments for stability, growth and opportunity in a continual effort to balance risk vs. reward. Capital is capable of moving across the planet relatively quickly in most cases and is always seeking the best opportunity for ROI and stability while trying to balance unknown risks and devaluation. Right now, the only games in town are the established economies, the US, Canadian and UK markets.

As you can see in the graph below US investments continue to grow as the best risk/reward for capital.

Our opinion is that until something dramatic changes this current global economic environment and risk unknown, capital will continue to rush into the US markets even if the US dollar continues to climb or oil continues to fall. The only thing that can change this equation is the one key factor in understanding risk vs. reward – when does the opportunity for reward outweigh the risk of complete failure by applying capital into any other foreign or non-established market environment? When investors believe the reward of moving capital out of the US equity markets in search of new opportunities or advantageous risk/reward setups in foreign markets exists, that is when we’ll see a change in investment dynamics resulting in more downside pricing pressure in the US markets – and we don’t believe that will happen within the immediate 4~6+ month span.

Pay attention to our most recent research as we have been dead-on in terms of calling these market swings. The NQ chart, below, shows how the tech heavy NASDAQ is leading the breakout while the YM and ES markets lag a bit. We believe all of these US majors are in the process of breaking to new all time price highs and as the foreign market turmoil slowly unfolds, we may see some moderate price rotation. Yet we believe the global economic dynamics that are currently in place create a very opportunistic, rich, green opportunity for continued capital infusion into the US equity markets and a continued moderate advance of the US Dollar.

Remember, there is now over $12 trillion in capital that has been created and introduced into the global markets over the past 10+ years. All of this capital is searching for projects and investments to develop suitable ROI and gains. Where do you think this capital is going to go for the most stable, most capable and most successful ROI available on the planet? Think about that for a minute – where else would you consider putting capital to invest for safe and consistent returns right now?

This weekend could prompt a massive upside price breakout early next week on continued positive economic news or lack of any foreign market concerns. The bias of the US equity market is, and has been, bullish – just as we have been telling our members. If you have been fooled by this recent price rotation or other research posts, please consider Technical Traders Ltd. services to learn how we can help you profit from these moves.

We know you value our research and hard work trying to keep you ahead of these market turns and swings. Please consider joining our other loyal members where you’ll receive exclusive updates, video content, trading signals and access to our proprietary price modeling systems and proprietary research reports. Our proprietary research is already showing us where this market should be trading well into July 2019. If you value our research, analysis and detailed reporting like this article, then please visit The Technical Traders to learn how you can join our other members and begin receiving our exclusive research and more.

See you in the markets!
Chris Vermeulen


Stock & ETF Trading Signals

Stock Trkr
Technical Analysis Confirms Support Level on the SPX

This week presented some interesting price rotation after an early upside breakout Sunday night. The Asian markets opened up Sunday night with the ES, NQ and YM nearly 1% higher this week. This upside breakout resulted in a clear upside trend channel breakout that our researchers believe will continue to prompt higher price legs overall. Our researchers, at Technical Traders Ltd., have issued a number of research posts over the past few weeks showing our analysis and the upside potential in the markets that should take place over the next few weeks.

We expected a broad market rally this week, yet it has not materialized as we expected this week. We consider this a stalled upside base for a new price leg higher. Take a look at this Daily SPY chart to illustrate what we believe the markets are likely to do over the next few weeks. There are two downside price channels that have recently been broken by price (RED & YELLOW lines). Additionally, there is clear price support just below $272.00 that was recently breached. These upside price channel breakouts present a very clear picture that price is attempting to push higher and breakout from these price channels.

Current price rotation has tested and retested the price support level near $272.00 and we believe this recent “stalled price base” will launch a new upside price rally driving price well above the $280.00 level.

With the holiday weekend setting up in the U.S. and the early Summer trading levels setting up, it is not uncommon for broader market moves to execute after basing/staging has executed. This current upside price action has clearly breached previous resistance channels, so we continue to believe our earlier research is correct and the US majors will mount a broad range price advance in the near future.

The VIX, on the other hand, appears poised to break lower – back to levels below $10 as the US major price advance executes. The VIX, as a measure of volatility that is quantified by historical price trend and volatility, should continue to fall if our price predictions are correct. If the US major markets continue to climb/rally, the VIX will likely fall to levels well below $10.00 and continue to establish a low volatility basing level – just as it did before the February 2018 price correction.

A holiday weekend, the start of lighter Summer trading and the recent upside breakout of these downward price channels leads us to believe the market will continue to push higher over time with the possibility of a massive upside “melt up” playing out over the next 2 – 6+ weeks. We believe this move will drive prices to new all time price highs for the US majors and will surprise many traders that believe the recent price rotation is a major market top formation.

Our exclusive Wealth Building Newsletter provides detailed market research, daily market video analysis, detailed trading signals and much more to assist you in developing better skills and greater success in your trading. One of our recent trade in natural gas using UGAZ, [check it out here] is already up over 26% and we believe it will run another 25-50% higher from here! We provide incredible opportunities for our member’s success. We urge you to visit The Technical Traders to learn how we can assist you in finding new success.

Our 53 years experience in researching and trading makes analyzing the complex and ever changing financial markets a natural process. We have a simple and highly effective way to provide our customers with the most convenient, accurate, and timely market forecasts available today. Our stock and ETF trading alerts are readily available through our exclusive membership service via email and SMS text. Our newsletter, Technical Trading Mastery book, and 3 Hour Trading Video Course are designed for both traders and investors. Also, some of our strategies have been fully automated for the ultimate trading experience.


Stock & ETF Trading Signals

Stock Trkr
How to Predict the Maximum Profit on Each Trade – Free Webinar

Every trader discovers this cold hard truth. Your profit isn’t made when you get in a trade, but when you get out. In fact, we constantly receive questions from our readers about how to avoid leaving money on the table in trades.

Sometimes people get out of a trade too early just to watch it take off and turn into a huge winner without them. Other times you watch your profits disappear because you hung onto your position too long. The key to winning trades is managing your position and timing your exit. Easier said than done, right?

That’s why we reached out to our friend John Carter at Simpler Trading. If you’re not familiar with John, he’s a 25 year trading veteran with a track record for spotting big moves and timing trades in the market for maximum profit. He’s also the author of the best selling book for traders, Mastering the Trade.

John is putting on a special free webinar for our readers this Wednesday May 23rd to show us how we can know exactly when to exit a trade for maximum gains.

Claim My Seat Now

John’s been working on something really special, and he’s sharing it with our readers. Plus, he’s going to explain in detail….

   ●   How to Catch the Biggest Turning Points in Real Time

   ●   Why ‘One Size Fits All’ Systems Can Burn Your Account

   ●   How to Get in Earlier on Explosive Moves with Confidence

   ●   The Simple Exit Rule that Can Generate ‘Easy Money’

   ●   How to Rapidly Grow a Smaller Account Part Time

   ●   How to Get Rid of Guesswork from Entries and Exits

   ●   How to Finally Treat Your Trading like a Business

        And a whole lot more….

These strategies work whether you’re trading Options, Futures, or any other derivatives. The key is understanding when the market is telling you to get out. You’ll see exactly what I mean on the free webinar.

Claim My Seat Now

See you in the markets!
Ray @ The Crude Oil Trader

P.S. This is going to be one of the most popular webinars we’ve ever had, so make sure you register as early as possible to Secure Your Spot Right Here

Stock Trkr
Natural Gas Flashes Buy Signals With Confirming Cycles….Here’s the Entry Levels and Patterns

Our research team has been following the energy sector quite intensely with Oil and Natural Gas making an impressive move. A little known seasonal pattern in Natural Gas has set up recently and we have alerted our members to this play which is already up over 16%. Our advanced price modeling systems and Adaptive Dynamic Learning Cycles have recently triggered another buy entry point which we share in this article but first look at the seasonal chart showing the month which Natural Gas is generally strong.

This seasonality table refers to particular time frames when commodities are subjected to and influenced by recurring tendencies that produce patterns each year.

It is our belief that Natural Gas will continue to climb higher moving well above the $3.00 level before the end of this month as well as potentially pushing well above the $3.20 level on continued price advances in energy.

Quite a bit of concern globally is driving energy supply fear that is pushing energy prices higher. This unique seasonal pattern indicates the potential for some strong upside price moves. We believe smart traders were already positioned for this move weeks ago, yet there is still quite a bit of opportunity from the recent entry point. See the left side of chart; below with oversold pullbacks.

A price move from current levels to above $3.00 would reflect an additional 4~6% price gain and a advance above $3.20 would reflect a 11% price advance. Again, our predictive price modeling systems and cycle modeling systems are showing us this has the potential for quite a bit more, but we can only estimate the $3.00 to $3.20 level is a sufficient upside target for this initial move.

If you would like help finding trade triggers like this and help knowing what to expect each day in the markets visit us at www.TheTechnicalTraders.com. We’ll help you to understand the market dynamics as the markets move, we’ll provide you with a comprehensive daily market video to show you what to expect and we’ll continue to provide you with this simple yet highly effective market research and analysis to help you stay ahead of the market moves. Our current trade in UGAZ is up 16% and likely going much higher. It just takes one or two of these types of trades to pay for your membership for years.

Our 53 years experience in researching and trading makes analyzing the complex and ever changing financial markets a natural process. We have a simple and highly effective way to provide our customers with the most convenient, accurate, and timely market forecasts available today.

Our stock and ETF trading alerts are readily available through our exclusive membership service via email and SMS text. Our newsletter, Technical Trading Mastery book, and 3 Hour Trading Video Course are designed for both traders and investors. Also, some of our strategies have been fully automated for the ultimate trading experience.

Get Our Newsletter Here

Stock & ETF Trading Signals

Stock Trkr
How Congestion Basing Can Present Incredible Opportunities

Our research team here at the Technical Traders wanted to alert our followers to the incredible opportunities that continue to present themselves in the current market. While many people have been overly concerned about a market top and price rotation in the US majors, the Energy sector and many others have seen incredible price moves.

Take a look at this XLE chart as an example. Yes, we know that Oil has rallied from about $60 to closer to $70 recently, yet we want you to focus on the price pattern that setup this move in XLE. Specifically, we want you to focus on the Multi-Month Base pattern in price between early February and early April of 2018 as well as the upside breakout that followed.

In true technical analysis theory, price tells us everything and indicators assist us in relating current price movement/action to historical price movement/action. This simple chart illustrates how price setup a top/resistance zone near $78 in early January 2018, broke lower in early February, then setup a multi-month price support base for nearly 60+ days. This price support base because an extended bottom formation and a “price support zone” by testing and retesting the critical $65~66 price level while establishing a series downward sloping high price peaks. When it finally broke free of this support zone, near mid-April, price skyrocketed higher (+17% or more).

With the stock market showing all the signs that it is in the late stage of a bull market this is when traders need to start identifying the hot sectors or high probability continuation patterns. Why? because we have entered a stock pickers market. It’s simple really, it means all the stocks are not going to be rising together and if you put your money into the wrong sector you could lose money while the markets rise.

So where is the next hot sector? We believe a very similar pattern is setting up in the IYT (Transportation Index) just like we saw on the first chart of the XLE. We feel an upside breakout move is likely to happen within the next two weeks.

The setup of this price pattern is a bit broader and more volatile than the XLE Multi-Month Basing pattern – which means the IYT upside breakout could be more volatile and dramatic in form (possibly driving price +10% to 20% over an extended period).

Additionally, the high price peaks are setting up in a similar format with lower high price peaks over the span of the base. Support near $182.50 to $185 is critical and we believe the eventual upside breakout will be an incredible opportunity for traders.

This breakout will coincide with much of our other analysis of the US major markets which we have been sharing recently.

Our other recent trade alerts, that are up well over 10% each are UGAZ, FAS, and TECL. These have been rocketing higher – as we predicted. On Friday we closed our TECL position which hit our resistance level and we locked in the 18.3% gains with our members. The single point of success for all of us is to manage our assets well in an attempt to achieve greater long-term success.

If you have not seen or read much of our recent analysis, please visit The Technical Traders to learn more and review our work. Our exclusive members are already positioned for many moves like this in the markets and more continue to form each week.

We urge you to consider joining our Wealth Building Trading Newsletter as a member to receive our incredible insight, proprietary research, and trade alerts to assist your own trading success. We have delivered insights and research to our members that have clearly informed them of where we believe the markets are headed for many months in advance. Imagine how powerful that kind of research could be for you?

53 years experience in researching and trading makes analyzing the complex and ever-changing financial markets a natural process. We have a simple and highly effective way to provide our customers with the most convenient, accurate, and timely market forecasts available today. Our stock and ETF trading alerts are readily available through our exclusive membership service via email and SMS text. Our newsletter, Technical Trading Mastery book, and 3 Hour Trading Video Course are designed for both traders and investors. Also, some of our strategies have been fully automated for the ultimate trading experience.

Chris Vermeulen

Stock & ETF Trading Signals

Stock Trkr
This Precious Metals and Mining Stock Chart Paints a Clear Picture

In this article, we are going to explain and show you an interesting pattern that has been slowly forming over the past year in the precious metals sector. This pattern along with our analysis point to a significant rally to start in the next 4 months for gold, silver, platinum, palladium, and miners.

Before we get into the details, below, it is important for every trader to step back and look at the bigger picture. It’s way too easy to get sucked into the markets movements, become an emotional trader, start losing a few trades, and second guessing your open positions.

We receive hundreds of emails every week from followers, and to be honest, this is one of the most powerful indicators available for letting us know when the majority of people are frustrated and have become emotional traders. Based on recent emails, their tone of the message, and market outlooks we can tell everyone is emotional and not seeing the market from a normal unemotional perspective.

There is no doubt it is easy to get caught up in the market and become an emotional trader if you don’t have a proven trading strategy for each type of market condition, advanced trading analysis, or trading guidance from a proven trading newsletter.

These past 30 trading days have been really tough to trade because the market is chopping around with huge one day moves back to back. Sometimes, its best to sit, watch and wait for some dust to settle before getting overly involved with new trades which is what we have done. Recently we traded YANG for a quick 8% profit, then we closed out two trades in TNA to profit 10.1%, then another 17.7% this month. Other than that, that’s about it. Now, with that said, things are about to get really exciting for us traders and we are getting ready for some new trades, both short term and longer term, looking forward many weeks and where the market should be headed.

Enough about all that emotional stuff, let’s jump right into the charts so you can see what we are excited about in this post!

The chart below shows several interesting data points and it’s fairly easy to see and understand.

Starting at the bottom of the chart you will see the purple line which is the Relative Strength Index (RSI). If we look back 4 years you can see a similar pattern unfolding which leads to a massive rally for precious metals back in 2016.

Knowing human behavior patterns don’t change, but rather repeat, it is likely we see another upside breakout and rally later this year. That does not mean, the price will go straight up, it simply means on average over time we should expect higher prices.

Before any new rally can take place, the precious metals sector must breakout above the pink falling trend line, just as it did in 2016.

If you didn’t notice already, we have posted our weekly cycle analysis for the precious metals complex. Over the next 6 – 8 weeks the sector should start to rally and try to break out. Again, this does not mean everything in the precious metals sector will rise. In fact, there are a couple areas you will want to stay away from. We share the best trade setups and alerts with our subscribers as they occur.

Weekly U.S. Dollar and Precious Metals Comparison Chart 

Here we show you on the chart the basic concept of how a falling dollar will push the price of gold higher, and how a rising dollar pulls metals lower on average. But this is not always the case. In fact, recent price action shows the dollar moving sharply higher while the precious metals sector moved sideways and higher. This looks like bullish divergence from their normal correlation and is likely caused by different global market dynamics injecting some new level of a fear that is funneling money into gold as a global safe haven.

Concluding Thoughts 

In short, we at The Technical Traders have been talking about the new bull market slowly setting up for precious metals since late 2017. As an investor and trader its always nice to be able to look forward knowing with a high probability what asset classes should be moving in and out of favor so we can position our capital accordingly.

If our analysis is correct once again, then over the next couple months this sector should be testing critical resistance to breakout and rally above the pink trend line. If you want to stay ahead of the markets and profit from our technical analysis then join the Wealth Building Newsletter now and get ready for this week!

53 years experience in researching and trading makes analyzing the complex and ever changing financial markets a natural process. We have a simple and highly effective way to provide our customers with the most convenient, accurate, and timely market forecasts available today. Our stock and ETF trading alerts are readily available through our exclusive membership service via email and SMS text. Our newsletter [sign up here], Technical Trading Mastery book, and 3 Hour Trading Video Course are designed for both traders and investors. Also, some of our strategies have been fully automated for the ultimate trading experience.

Chris Vermeulen

Stock & ETF Trading Signals

Stock Trkr
Gold – A Unique Repeat of the 2007 and How to Profit

Since Spring is in the air here are some colorful charts and show you where we feel the price of gold and stocks are within the current market cycles. Below are monthly charts of the SP500 index and the price of gold. The first chart shows a pattern that gold formed just before stocks hit all time new highs and the bear market started. The chart is a little noisy, lots of analysis, but we color coded each area to break it into clear bits size analysis. The chart shows you what happened and what is likely to happen again.

This is the current monthly chart, and if you compare the price action with the above chart, you can’t help but think things are set up in a similar formation as 2007 – 2008.

It means, the stock market is nearing a significant top and all everyone’s long term buy and hold investments should be reviewed and prepared for a rebalancing later this year. Precious metals should do well this year, stocks should top out and for you to preserve their hard earned money cash is always king for those who don’t actively trade. But if you do trade or you are an active investor huge amounts of money can be made during times of increased volatility, precious metals, and falling stock market prices.

What an AWESOME DAY! All our positions rocketed higher with our most recent entry in SIL (silver miners) leading the way. We closed our TNA position to lock in 17.7% on the second portion of that trade. Yes, we do feel the markets will run higher, but we also like to lock in the quick, easy money trades like TNA especially when the overall market is looking and feeling a little top heavy for a day or three. The chart below of the SP500 index paints a color picture of what I feel will unfold in the very near term.

Our analysis of the markets was DEAD ON. We called the 2678 level on the ES as a key resistance level to watch before any breakout to the upside would potentially happen. We also called this market bottom nearly three weeks ago on March 28, 2018 and we locked in 17.7% today with our subscribers. We have been nailing these market reversals with incredible accuracy all year and we are just getting started with our Advanced Dynamic Learning systems [preview that system here] we have developed.

The bottom line is that smart traders and investors look into the future and position their money where they feel it will increase in value the most. We say this all the time, which is money is continually looking for the best ROI and flows from one asset class to another as the market evolves. With potentially another major financial crisis forming, war, and a bear market in stocks we do not doubt that we are about to experience a huge rebalancing of money over the next few years, and I feel precious metals may be the next little hot pocket for trades.

So if you want our pre-market video analysis showing you where the markets, oil, and gold are headed every day and want out ETF trade alerts be sure to join the Wealth Building Newsletter Here!

Chris Vermeulen
The Technical Traders

Stock & ETF Trading Signals

Stock Trkr
Free Webinar: Your Second Chance for the Marijuana Boom in 2018

Our trading partner legendary speculator Doug Casey invites you to take part in the FREE “Pot Stock Millionaire Webinar”. This free Summit will guide us through how we can take advantage of the coming second marijuana boom.

Doug is up $1 million dollars with just ONE tiny pot stock, a 1,900% gain. And now Doug and his team have found 5 new pot stocks that will brings us those same profits.

Space is limited so Reserve Your Seat Right Here, Right Now

The Pot Stock Millionaire Summit with Doug Casey, Nick Giambruno and Justin Spittler takes place Thursday, April 26th at 8 p.m. Eastern Time. Since this is hosted on a private website you must pre register and details for access will be emailed to you.

And the cost to you? Zero….It’s all FREE!

If you missed out on the first wave of marijuana investing don’t miss your second chance to become a Pot Stock Millionaire in the Marijuana Bull Market of 2018. The 2018 boom is expected to be 8 times bigger than the first.

During this free Webinar we’ll learn….

  •   How famed speculator Doug Casey became a marijuana millionaire with one penny pot stock
  • Why the 2018 marijuana boom will be 8 times bigger than the first… when pot stocks averaged peak gains of 24,000%
  • The only two ways to play the marijuana bull market in 2018 for the chance to turn a few hundred dollars into a million or more
  • And 5 marijuana stocks that are set to return 500% each

And this is just a small sample of the exclusive information that Doug and the team will share during this event.

FREE ACCESS to our April 26th event: Doug Casey, Nick Giambruno and Justin Spittler will reveal why the marijuana boom is just starting right now. And how 2018 will be the year of marijuana millionaires for those who get into tiny, little known pot stocks today.

Plus, you’ll discover why some of the best profit opportunities in marijuana have nothing to do with growing or producing the plant. Instead, Doug and the team will share the most promising “pick and shovel” plays. These are companies on their way to becoming the next “Home Depot of Pot” and “Amazon of Weed.”

And Doug Casey will break down how he became a marijuana millionaire with a penny pot stock and why he sees bigger opportunities in today’s marijuana boom for those who get in now.

Access to a brand new video training series: Released for the first time exclusively for this event, these 3 trainings will show you:

  • Why everyone who thinks the biggest gains in marijuana have already been made are dead wrong. We’re actually at the very start of the biggest marijuana mania in history.
  • Why you don’t need to know anything about marijuana or investing for the chance to become a marijuana millionaire in today’s bull market.
  • How marijuana stocks are delivering similar gains to Bitcoin and cryptocurrencies… but are much safer and easier to buy. And we’re actually in an earlier stage of the marijuana boom than we are in Bitcoin.
  • Why regardless what the federal government does, marijuana legalization is a runaway train and the best opportunity today to turn a couple of hundred dollars into a fortune.

And much, much more…

You’ll be able to watch these short, information packed videos right on your computer or phone.

PLUS… you’ll be able to download the transcripts directly to your computer, print them out and read them at your leisure.

During the first marijuana mania, the best pot stocks averaged peak gains of 24,000%. And that was with just two states (Washington and Colorado) legalizing recreational pot. Now that it’s legal in California, and Canada is set to go recreational this June, we’ll see the biggest marijuana profits in history from this bull market.

You’ll get all the details in our training and Summit.

Stock Trkr
Adaptive Dynamic Learning Predicts Massive Market Bottom

Our research team at Technical Traders Ltd. has been hard at work trying to identify if this recent downside price move is more concerning or just a rotational move. The recent global news regarding the US/China trade tariffs as well as the fallout that started nearly two weeks ago in Technology with Facebook, Snap and others has spooked the markets. Our additional research shows that China and Asia are extremely fragile at the moment and the global Central Bankers as well as the Real Estate market could be key to any future unraveling of the markets.

Yet, at this time we believe our predictive modeling systems and analytical systems are indicating a strong market recovery is just days away. As we have discussed earlier, capital is constantly searching for the safest and most reliable ROI throughout the planet at all times. We believe the current market environment will show signs that stronger, more established economies will continue to benefit from capital migration as a result of this new wave of uncertainty plays out. The US DGP growth rate over the past 2 years has been exceptional – increasing over 200% from 2015-2016 averages of 1.48%

As you might have read from our China/Asia Implosion research, there are many factors at work currently in the markets and the one thing that is a constant is consumer and debt cycles. Additionally, we have been relying on our cycle analysis, Adaptive Fibonacci modeling system and our incredible Adaptive Dynamic Learning modeling system (ADL), for much of our analysis throughout the end of 2017 and early 2018. Today, we are going to share what we believe to be one of the most amazing analytical calls of this year – a potentially massive rally in the US markets.

First, our Weekly Fibonacci modeling system is still showing strong bullish signs while indicating recent price rotation is below bearish trigger levels. Because of this last component, we are still concerned that unknown factors could derail any price recovery that our advanced modeling systems are predicting. Yet, we believe the core elements of Capital Migration and the fact that capital will chase the greatest ROI and safest environment for future liquidity and growth indicate that the US markets are the only game in town. The newly established price channel can be clearly seen in the chart below.

As we consider the fragility of the global markets as well as the potential that foreign and domestic capital will likely be migrating into the US Equity markets in an attempt to maintain ROI and liquidity that is simply unattainable in other global markets. Risks are starting to stack up in many foreign markets with Brexit, debt issues, cycle rotations and other issues. Yet, the US markets have recently been unleashed in terms of growth expectations and regulations.

This S&P Daily chart showing our ADL predictive price modeling system is clearly showing the price anomaly that is currently setting up. Prices are been pushed much lower – below our price expectations shown as DASHES on the chart. Yet we need to pay attention to the dramatic price reversal setting up to the upside. Without our ADL price modeling system and the ability to identify these types of setups, we would have little knowledge that this type of dramatic price increase is about to hit the US markets.

Additionally, when we compare the ES chart (above) to this NQ chart (below), we can see another price anomaly that is setting up in the US markets. These types of price anomalies are quite unique in the sense that they represent a price disconnect that usually results in a violent and dramatic price reconnect. In other words, when these types of price anomalies happen, price is driven outside normal boundaries of operation for periods of time, then it recovers to near the projected price levels – just like it did in early February 2018 with a dramatic downside price correction.

Lastly, this SPY chart below is confirming all of our price analysis with a very clear picture of the price anomaly that is currently setting up. External news factors have driven the current price to well below the expected ADL levels and setup what may turn out to become a Double Bottom in the process. Yet, the most critical part of all of this is the potential of a massive 10% or greater price rally over the next 3 to 10 days.

Many people simply don’t believe our ADL system can be this accurate, yet we urge readers to visit www.TheTechnicalTraders.com to review our research articles from late 2017 and early 2018 to see for yourself how well it has worked out so far. You don’t want to miss this move and what follows. This move will be a huge opportunity as our analysis is showing the potential for 8 to 12+% price advances over the next 30 to 60 days.

We are writing this message to alert all of our members and followers that we are uniquely positioned to take advantage of this move while others are preparing for the potential price decline that is evident by move traditional technical analysis modeling system. If you want to learn how to stay ahead of these moves and profit from this type of adaptive predictive price modeling, then please visit our website to learn more about our stock and ETF service for active traders and investors.

Our articles, Technical Trading Mastery book, and 3 Hour Trading Video Course are designed for both traders and investors to explore the tools and techniques that discretionary and algorithmic traders need to profit in today’s competitive markets. Created with the serious trader and investor in mind – whether beginner or professional – our approach will put you on the path to win. Understanding market structure, trend identification, cycle analysis, volatility, volume, when and when to trade, position management, and how to put it all together so that you have a winning edge.

Stock & ETF Trading Signals

Stock Trkr
This Week’s Stock Market Analysis & Warning in Layman’s Terms

As you likely know, the stock market, trading, and even long term investing are not easy. That’s why in this post we want to make the complex simple for you. We will do this in a way that will give you that “Eureka!” moment regarding knowing what the stock market is doing now, and where it is headed over the next 12-36 months.

Last August we spotted trends in the underlying financial system that are very early warning signs that the bull market in stocks will be coming to an end, along with this growing economy. There is a ton of data taken into account for this information, but we have broken it down into simple bite size points that simply make logical sense, from a technical analysts perspective.

First Warning

Back in April 2017, we posted an article showing the first set of data that most traders and investors do not see or follow, mortgage delinquency rates. Delinquency rates in Single Family Residential Mortgages and other Consumer Loans began to climb through the second half of 2016 and continue to rise today. We shared with readers a way to take advantage of this using the Real Estate Bear Fund (DRV). This fund is now up over 20% and climbing as it rises when real estate falls. The rise and timing of this delinquency rate increase coincide almost identically with the Fed when they raise rates. And the problem is not just mortgages defaulting, the same is happening with commercial loans, and credit card debt.

Just look at what has the fed being doing like a mad-man of late? Ya, jacking up rates like they are going out of style!

The graph below shows a red line which is the fed rate, and as that rises so do loan delinquency rates (blue line). You will also see the grey shaded areas on the graph, and these are bear markets (falling stock prices). It’s obvious that we are headed towards financial issues once again with debt and the stock market.

Mortgage Rates and Delinquency Rates on the Rise

On March 18th 2018 we post an update showing how real estate foreclosures are starting to rise dramatically! Subscribers to our Wealth Building Trading Newsletter took advantage of this as we got long SRS inverse real estate fund which jumped over 5% in the first two days of owning it.


Second Warning – Asset and Business Cycles

Because we are traders and investors our focus is on making money, so we are only looking at the blue wave/cycle on the diagram below. The blue cycle is the stock market, and the numbers posted along that cycle indicate which stocks/assets should be the most in favor, rising.

As you can see the numbers 9 and 11 at the top are both commodity based (precious metals and energy). And knowing that commodities typically perform well just before a bear market in stocks unfolds, we are on the cusp of a new trade that could last a few months and post significant gains.


COMMODITY PRICE INDEX

Take a look at the commodity index chart below. Without getting to deep in to stage analysis I will just say commodities have formed a very strong “Stage 1” and are primed and ready for a multi-month rally.

Third Warning – Psychology of the Market

This market appears to be in a EUPHORIC “wonderland” moment driven by the fact that the global central banks have created a waterfall event of cheap money that is driving all of this asset valuation recovery. And, as capital is continually searching for the best environment for ROI, it is moving into the best areas of the global economy for survival purposes which we feel should soon be commodity-related assets, then eventually cash once the bear market takes hold.

Stock Market Conclusion

In short, as long as the capital continues to flow into the securities (stocks) and commodities in search for the best return on investment, we will continue to see markets hold up. But, stay cautious because when the markets turn and money is no longer looking for the next top performing sector or commodity, but rather just wants to exit investments as a whole and convert to cash (cash is king), that is when the bear market starts, and it could be very quick and violent.

Additionally, as we’ve shown with these charts and graphs today, we are entering a frothy period in the markets, and we would urge all investors to be critically aware of the risks involved in being blind to these facets of the current stock market and housing bubbles.

With 53 years experience in researching and trading makes analyzing the complex and ever-changing financial markets a natural process. We have a simple and highly effective way to provide our customers with the most convenient, accurate, and timely market forecasts available today. Our stock and ETF trading alerts are readily available through our exclusive membership service via email and SMS text. Our newsletter, Technical Trading Mastery book, and 3 Hour Trading Video Course are designed for both traders and investors. Also, some of our strategies have been fully automated for the ultimate trading experience.

Chris Vermeulen
Technical Traders Ltd.

Stock & ETF Trading Signals

Stock Trkr
Here’s Why it Might Be Time to Take Natural Gas Seriously

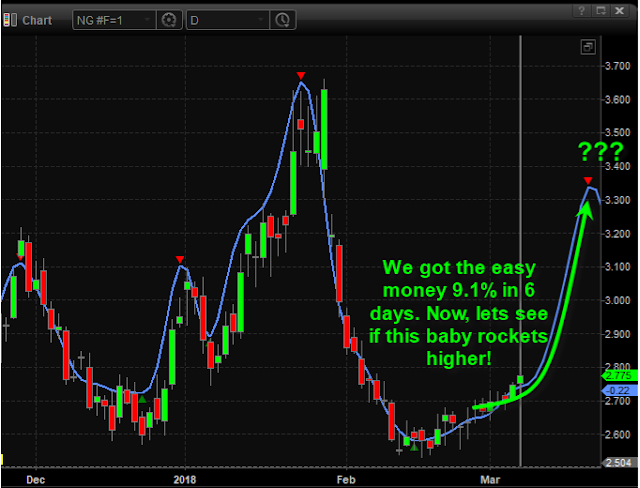
Last week we identified a prime chart pattern in natural gas that matched our technical analysis and cycle price prediction system. This type of setup is our favorite as it leads to quick juicy profits and the last setup we had like this in natural gas I think we pocketed 74% return in 12 days using the ETF UGAZ.

Charts speak for themselves so let me show you what myself and our subscribers are into right now. We are long UGAZ and today (Wed March 7th) we locked in 9.1% profit with UGAZ on half the position. Our stops are now at break even, and we are looking for the final blast off stage, which may or may not happen, but we are ready!

We share this analysis so that you have some real predictive data to work with through March. We are not always 100% accurate in our modeling systems predictions or accuracy, but you can spend a little time reading our research reports through most of this year to see how we’ve been calling these market moves since well before the start of 2018. Visit the Technical Traders here to see what we offer our subscribers and learn how we can assist you in finding great trading opportunities. In fact, pay attention to the market moves as they play out over the next few weeks to see how accurate our research really is. We’re confident you will quickly understand that we provide the best predictive analysis you can find and are proud to offer our clients this type of research.

Get ready for this move and don’t miss the future ones. We’ll keep our members aware of all of these moves going forward so they can take advantage of these opportunities to generate profits.

Hope to see you in our member’s area, as well, where we can share more data and research to help you profit from these moves – visit The Technical Traders Right Here to learn more.

Stock & ETF Trading Signals

Stock Trkr
Crypto "Trade of the Decade" Free Live Event

$500 billion was recently wiped off the crypto market. Even compared to the recent $4 trillion stock market drop, that’s a huge sum of money to just disappear. Which is why thousands of crypto investors have been running for the exits.

Should you be worried?

Well, one thing’s certain: The days of simply buying and holding any old crypto are over. To show you the best way to make money in cryptos today, we’ve asked our trading partner and crypto expert, Tama Churchouse, to host this free global live event.

Tama is recently back after attending the “Satoshi Roundtable,” a private, invite only gathering of some of the most successful and renowned crypto experts in the world. He’ll update you on how these key players view the recent crypto correction and whether the recovery will continue.

And he’ll reveal what he recommends you do with your money right now whether you currently own any cryptos or not. And maybe most importantly he’ll be revealing his crypto “Trade of the Decade”.

This is a play that Tama’s work shows could generate up to 1,150% over the next 12 months no matter how crazy the crypto markets might seem.

This live event is free to attend but a reservation is required.

When: Wednesday, March 7th at 8 pm Eastern Time

Cost: FREE if you sign up through this page right now

Bonus: You’ll have a chance to claim a FREE special report Tama has personally published to help everyday investors trade the cryptomarkets the way he has.

Please Click Here Now to Sign Yourself Up

See you in the Markets,
The Crude Oil Trader

Stock Trkr
Gold is Setting Up for a Massive Upside Rally

Over the past few months, our research team has nailed many of the recent moves in the Metals market thanks to our advanced price modeling systems and detailed research. Recently, we’ve been watching a setup play out in Gold that has excited us. The potential for a massive upside rally that should originate as early as March 19 (only a few weeks away). The reason this is so exciting is that a breakout move in the gold market would indicate a global rush into a protective market because of fears originating from other market sectors.

This first chart is a Weekly Gold chart highlighting our Adaptive Dynamic Learning (ADL) price modeling system. This price modeling system is capable of identifying and mapping historical price and technical patterns as well as ranking and evaluating future price moves – showing only the highest probable outcomes. This analysis is designed to teach us exactly what price should be doing based on a current price pattern. Please notice the two highlighted areas, a high price level near April 15 (near $1450) and a high price level near the end of April or early May (near $1550). Both of these moves represent massive upside legs in Gold. The first being nearly 8.5% and the second being nearly 18% advancements.

This second chart illustrates our Adaptive Fibonacci price modeling system on a Gold Weekly chart. This price modeling system tracks price rotation and uses a unique form of AI to apply Fibonacci price rotation price models showing us where price rotation is happening and what to expect in future moves. Please note the similarities in the projected future price levels in addition to the moderately tight price flag that is setting up on the right side of this chart. With higher lows and a multiple top formations near $1365, this new analysis plays perfectly with our most recent analysis.

Over the past few weeks, we alerted our members to a breakdown in price which we traded DUST inverse gold miners ETF, followed by a recent price basing/bottoming zone and breakout. We have been warning our members that the US major markets would experience weakness over from February 20 till about March 2 where a new price rally/breakout would begin. We’ve recently called a basing level in the NQ near $6500 that should happen within the next few days where support should be found before a price rally/breakout happens to create a peak near March 15. Everything we have been warning our clients about has played out almost perfectly.

Now, our price modeling systems are warning of a metals market breakout/rally originating near March 26th. Why is this so important to us and why do we believe this could be an ominous signal? The answer is simple, for the metals markets to experience this type of breakout move, some global concern must be driving a fear component and driving global investment into the metals market in a protectionist move. So, we are expecting some market event to play out near the middle of March 2018 that generates a bit of fear, resulting is a massive increase in the price of Gold and Silver. This move appears to peak near May 21-28, 2018 before weakening a bit.

We can’t stress enough that you should not worry about the overall market implications of a crisis event at this time. Our analysis of the US majors shows that the remainder of this year should continue to be relatively positive in price activity with overall higher than average price volatility after the recent surge in volatility. In other words, this crisis event appears to be an external event – not a US event.

If you want to know how you can profit from these types of move and how our research team can assist you, visit The Technical Traders Here to learn more.

Stock & ETF Trading Signals

Stock Trkr
How to Trade as We Near March Top in Equities

Our focus is to provide you with updated and accurate market price predictions for all of 2018, we believe we are entering a period that will be fantastic for traders and active investors. We believe this recent volatility has shaken out the low volatility expectations and will allow the markets to start moving in a more normal rotational mode going forward. This means we’ll have lots of trading opportunities to profit from.

For those of you who have not been following our research over the past 2 to 3 months, we urge you to visit our Technical Traders Ltd. website to read our published research and to learn how we’ve been calling these moves in the markets for our members. We called the early 2018 market rally weeks before it started. We called the lower price rotation over a month before it happened. We called the bottom in this price correction almost to the day and told our members that we believed a very quick Pennant price formation was set up that will drive prices higher which we have seen this week.

Members know price should move higher leading to a March 15 price cycle peak. After that point, we’ll refresh our analysis for our members and attempt to provide further guidance. Today/Friday we closed our Short position in UVXY for a quick 50% in 9 days.

In this post, we are going to focus on one of our price modeling systems based on Adaptive Fibonacci Price Modeling and show you why we believe this recent price move will likely stabilize within a range while attempting future moves. Let’s start with the INDU.

WEEKLY DOW JONES CHART

This first chart is the INDU Weekly chart with our Fibonacci Modeling system at work. We’ve highlighted certain areas with notes to help you understand it in more detail. This adaptive modeling system tracks price high and low points in various cycle lengths, then attempts to adapt a major and moderate cycle analysis model to key Fibonacci predictive points. The end result is that we can see where key Fibonacci price trigger levels are and also see what our predictive modeling system is telling us where prices is likely headed.

This weekly, chart shows us that the current support level (originating from near April 2017) is nearly exactly where the current price correction found support. This level is currently acting as a strong base for current price action and will likely continue to provide very strong support going forward. You can also see the Bearish Fibonacci Price Level near 25,776 that is acting like Resistance. Notice that this Bearish Fibonacci Price Level also coincides with the BLUE Fibonacci projected price level.

It is still our opinion that the US major markets will continue moderate price rotation within these levels for the next 5+ days before reaching an intermediate price low cycle near February 21. After this price low cycle is reached, we believe a new price advance will begin to drive the US majors higher reaching a peak near March 15.

DAILY DOW JONES CHART

This next INDU Daily chart provides more detail of our projected analysis. Again, please read the notes we’ve made on this chart to assist you in understanding how we are reading it and interpreting it. The most recent price peak and trough clearly show the volatility spike that happened last week. It also shows us that the recent trough in price aligned almost perfectly with a Bullish Fibonacci Price Level from November 2017. We interpret this as a clear “double bottom” formation at Fibonacci Support.

The purple horizontal line is the Support Level originating from the earlier, Weekly, chart for reference.

This Daily chart shows more detail in terms of the Fibonacci Projected Price Levels and also shows the wide range of price that we are currently experiencing. Over time, this wide range will likely diminish a bit as the trend continues to consolidate price rotation into more narrow bands, but right now we have a very wide range of price volatility that we have to deal with.

Additionally, the current upward price rotation is above the Bullish Fibonacci Price Level from the recent lows. This is a clear indication that prices want to continue to push higher till some new price peak is in place. We expect that will happen fairly soon.

Notice how the Fibonacci Projected Price Levels are quite a way away from the current price levels? This is because the recent increase in volatility is alerting the price modeling system that we expect larger range price rotation. As newer and more moderate price rotations form, these levels will begin to consolidate a bit with new price levels.

As of right now, our analysis has really not changed much since last week. We believe the Feb 21 price low will prompt a rally into the March 15 price peak. At that time, we’ll take a fresh look at these modeling systems to see what they can tell us about the future.

DAILY SP500 (SSO ETF) CHART

The last chart I wanted to share with you is the Daily SSO chart. This chart helps to firm up our analysis of what to expect in the immediate future as well as continues to support our analysis that the US Majors will likely stall near current levels and retrace slightly headed into the Feb 21 price low. Remember, we don’t believe this Feb 21 price low will be anywhere close to the recent lows. This move lower will be much more subdued and moderate in size and scope.

With this SSO chart, the Adaptive Fibonacci Price Modeling system is showing a potential “Major Bottom” near the recent lows. This happens when the system identifies a potentially massive or major price bottom. Over time, the modeling system will confirm this trigger or replace it with a new trigger when it forms.

We still see the massive price volatility in this chart. We still see the Fibonacci Price Trigger Levels that tell us we are below the Bearish Price Trigger (near the recent top) and above the Bullish Price Trigger (near the recent bottom), so what should expect price to do? At this point, the most recent Price Trigger Breach is the Bullish Price Trigger – thus we are expecting prices to continue higher overall. The new Bearish Fibonacci Price Trigger, below the current prices, is what we would watch for any signs of price weakness. When that level is breached, then we begin a new potential down leg.

Right now, we will issue this one simple warning – the upside move is likely to be ending soon and preparing for our February 21 price low point. The fact that prices are showing that they’ve already reached the Fibonacci Projected Price Level is telling us this upside leg may be over for now which is the reason we exited our short UVXY position here for a 50% profit.

Next, we expect the US majors to rotate lower for a few days headed into a February 21 price low. This will be following by an almost immediate and strong upside push to a March 15th price peak.

This means we will be setting up for some great trades over the next few days/weeks. Imagine being able to know that near February 20-22, we should be able to “pick” the best opportunities for quick trades where the US majors begin a new up leg? Also, imagine how critical this type of information can be to you going forward?

Our research team at The Technical Traders site has a combined 53 years of trading and analysis experience. We develop specialized and proprietary price modeling systems, like these, to assist us in being able to provide our members with an “edge” in the markets. Of course, we are not always 100% accurate with our predictions – no one can be 100% accurate. We simply do our best to make sure our members get the best we can offer them each and every day. We want them to understand the opportunities that are playing out and we help them find the best trade triggers for profits each week.

Stay tuned for our next post on Sunday with an instant trade setup, 

If you find this information valuable and would like to include it in your daily trading activities, visit here and sign up for the Technical Traders Wealth Building Newsletter today!

Chris Vermeulen

Stock & ETF Trading Signals

Stock Trkr
Three Trades for This Wild Market

It has been an emotional ride for most traders since stocks started to sell off last Friday in a big way. This crash we just experienced is VERY much like the Aug 2015 crash. Price and volatility both have parabolic price movements that could either make you a lot of money or lose a bundle depending on where your money was positioned.

This post is to quickly share three recent trades we have taken one of them (REALLY BAD) and what to expect in the markets moving forward.

On Monday while the markets were under serious pressure cascading lower our only open position at the time was DUST. This is an inverse gold miners fund that allows us to profit when gold stocks fall in value. We had been expecting gold stocks to fall for a couple weeks and got into the position on Jan 26th. Gold stocks fell quickly and we took partial profits at 11% within 3 days.

We continued to hold the balance of DUST in anticipation of a second leg down in gold stocks which our technical analysis was showing should happen within a couple days which it did. On Monday, Feb 5th while stocks were under more selling pressure money rotated into the gold stocks as a safe haven and that is we decided to close the position with a 20% profit it 7 days. This was a good trade, but the next one isn’t.

Also, on February 5th we were anticipating the panic selling and looking for a washout low to be put in place Monday/Tuesday of this week. Thus far everything has played out exactly as we expected in terms of price action. What I love about technical analysis is that if done correctly you can predict, or at least have a very good idea of what price should do next, and because we knew panic selling was coming we were not totally caught off guard. But I will admit, I expected half the price movement and volatility that actually took place this time around.

Terribly Unfortunate Trade

* I always short UVXY when the vix is high, and fade the fear. But no shares were available to short Monday.

* The only other way to do this was to buy XIV and inverse VIX fund which works in most cases but not nearly as good as short selling UVXY.

* Volatility jumped 100% Monday, XIV fund imploded and lost 98% of its value catching hedge funds, professional traders, and us off guard.

* XIV is still trading, it will take many months to regain and reduce some of its draw down.

Tuesday’s Clawback Trade

During extreme situations like XIV position dropping 98% there are two ways to deal with it. Take the loss and move on, or use the extreme market conditions to get back into a trade and catch the next big move to help minimize XIV draw down. So we took a short sell trade on UVXY Tuesday at the open. The VIX was set to gap sharply higher into a level it has only ever reached a few times in before. By shorting the VIX it means we profit when the VIX falls in value which it did.

We opened the trade right at the opening bell and the VIX when into free fall hitting our first profit target within 18 minutes for a 36% profit. We still hold half the position expecting a larger gain over the next few days. Currently, this short UVXY position is up over 50% and we are looking for roughly 70% before we close it out.

Take a listen to my audio Squawk Box broadcast today to subscribers to get a feel for the XIV, volatility, and the stock market…..Visit Here

CONCLUSION

In short, February has been exciting, to say the least. I feel this price action is a major warning and signal that the bull market is coming to an end. What I feel is going to unfold is similar price action we say from Aug 2015 crash – Feb 2016. Big price rotation, and elevated volatility. And this time, stocks may not find support at the lows created this week and trigger the first leg down in a new bear market.

It’s likely going to take most of 2018 to form and unfold, but we aware…

Join us at Technical Traders Ltd. Wealth Building Newsletter and take advantage of the next major trend changes and profit.

Chris Vermeulen
The Technical Traders Team

Stock & ETF Trading Signals

Stock Trkr
Gold And Gold Miners Preparing for Big Move

Just a few days ago we alerted our members and followers to a massive setup in the Palladium market that had not been seen in years. This chart formation provides an incredible opportunity for a trader to take advantage of and profit from the expected price decline. We alerted our members and followers on January 24th of this move.

As of today, Palladium has rotated downward by over 9% from the recent highs and should continue to move lower as this multi-month rotation extends. Even though this initial move lower (-9%) reaches our initial predicted target levels, we still believe support won’t be found till prices reach near the $1000 price level. If that support fails to hold, the price of Palladium could fall to the $900. This total move could be over -20% by the time this downward swing ends.

As an additional bonus, the other metals and Miner ETFs are starting a move in correlation with this massive rotation in Palladium. The aggressive move in Palladium may become a catalyst for the other metals and miners to sell off further.

We warned weeks ago about this cycle top in gold and how it should rotate lower and move to near $1300 before finding support. This move has just started really and would equate to a -3.8~4.2% downward price correction.

The ability to see these moves and act on them provides our members with the ability to take a single trading signal and deploy multiple successful trades from it. We got our member’s long DUST near the very bottom of the market in anticipation of this move in the metals markets. Knowing that this move was set up and that it could be somewhat aggressive, we simply waited for the proper setup and trigger to alert our members.

The overall potential from our DUST trade remains substantial. Currently, we have already locked in +11% for our members and we believe the final move could be much larger.

The reason we are alerting you, today, of the progress of our calls, is that the market conditions are changing, and these types of trade setups are going to happen every month and a lot of money can be made by taking advantage of them each month. Join our Wealth Building Newsletter here at The Technical Traders and let us boost your trading returns with our daily analysis video, market updates, and trade alerts.

We just closed out another winning trade and members locked in a quick 9.1% profit with falling price of natural gas.

Our articles, Technical Trading Mastery book, and 3 Hour Trading Video Course are designed for both traders and investors to explore the tools and techniques that discretionary and algorithmic traders need to profit in today’s competitive markets. Created with the serious trader and investor in mind – whether beginner or professional – our approach will put you on the path to win. Understanding market structure, trend identification, cycle analysis, volatility, volume, when and when to trade, position management, and how to put it all together so that you have a winning edge.

Chris Vermeulen
Founder Technical Traders Ltd.

Stock & ETF Trading Signals

Stock Trkr
Have You Seen Palladium’s Tradable Price Pattern?

Are you prepared for the next big move in the metals markets? Would you like to know what to expect in the immediate future that could save you thousands of dollars? Then pay attention to this message as we share something most traders are overlooking right now.

Our research team at Technical Traders Ltd. have spent years developing our skills and financial modeling systems. Right now, many traders are seeing the big upward price swings in the metals as a sign that prices will continue higher. Well, in the long run, they are correct. But right now we believe the metals will roll over and trend lower for the next few weeks setting up for the next leg higher.

Palladium is a perfect example of this Rollover expectation. Both the current long term monthly chart shows signs of a massive double top, and the daily chart WEDGE/Pennant formation is likely a washout high rotation pattern that will prompt lower prices over the next few days/weeks.

MONTHLY PALLADIUM CHART

This monthly chart to us is nothing more than a reason for the overbought Palladium market to have a minor pullback before potentially running to new highs. We could see a couple weeks or potentially a few months of weaker prices, but the point here is that price is overbought and at resistance on the long-term chart and imminent pullback is likely to occur for a tradable short or to re-enter after the price has corrected and shows signs of strength for another run higher.

DAILY PALLADIUM CHART

As you can see from this chart, we are expecting a rotation lower based on our modeling systems predictive capabilities that will result in a substantially lower price swing – possibly as much as -8 to -10%. We believe support will be found just above the $1000 price level.

Additionally, our Adaptive Dynamic Learning (ADL) modeling system is designed to scan historical price activity of any chart and find the unique price and technical indicator formations that operate as DNA markers for the price. It then continues to scan for new or repeating DNA markers in the market to determine probable outcomes of the price going forward. In this case, the ADL system is predicting a lower price swing to near $1020 near or after February 8th. After this price contraction, the ADL system is expecting a solid rally to form.

This should be important to all investors because long traders in the metals should wait for this pullback to happen before getting into heavy positions. Our analysis shows we should see a -4 to -8% price pullback within the next week or two before support will be found. Obviously, buying near the lowest point is the objective of trading and we believe the February 5th through February 8th time frame should provide the optimal bottom rotation period for metals traders.

Would you like to receive daily video analysis of our research for all the major markets as well as continue to receive our advanced research reports? Want to know that the US majors Indexes are going to do tomorrow or next week? Take a minute to investigate The Technical Traders [just visit here] to learn how we can assist you in your trading. Learn how we called this move in the US Indexes for 2018 and how we can continue to identify market moves before they happen with our proprietary modeling systems.

Chris Vermeulen

Stock & ETF Trading Signals

Stock Trkr
Are Traders Interested in Living Longer and Feeling Better?

For some reason my trading partners and our readers seem to be more interested in their health and longevity than my friends or even family members. It’s for that reason we are excited to give you a quick heads up about something we think is going to be very important to them. And it’s happening really soon.

On February 1st, at 6:00 p.m. est, the “Live Longer, Feel Better!” documentary will air its live first episode. And believe me, you won’t want to miss even ONE of the experts that director Michael Beattie has brought together.

I’ve had a sneak peek at it and this is absolutely going to change how you think about getting older and maintaining your health. If you’re AT ALL concerned about where you’ll be in 30 years time, you MUST see this.

Click Here to Watch the Trailer

The documentary series and everything that accompanies it, presents you with a real action plan to avoid disease as you enter and enjoy your later years. But the earlier you start, the better!

On February 1st, you will be able to see it all at NO cost, Right Here!

The current epidemic of Alzheimers, Diabetes and other avoidable diseases is stealing our futures and condemning thousands of people to a nursing home. No one has to go through that!

Let’s take that future back NOW.

Please make time to watch this, and help me spread the word if you can.

To your health,
Ray C. Parrish
aka the Crude Oil Trader

PS. One final note – Each episode of this incredible 7 part series will be online for only 24 hours from release. Make sure you register right now so you don’t miss a single thing. You’ll be excited by what you’re about to discover.

Below is a Quick One Minute+ Video Trailer We Below

Stock Trkr
How to Know if This Rally Will Continue for Two More Months

Our trading partner Chris Vermeulen has our readers off to an amazing start for 2018. If this is any sign of what we have to come this year we are in store for one of our best years of trading possibly ever. 

Chris just sent over his latest article and it explains how our old reliable Transportation Index is guiding the way once again. Read “How to Know if This Rally Will Continue for Two More Months”.

Our research has been “spot on” with regards to the markets for the first few weeks of 2018. We issued our first trade on Jan 2nd, plus two very detailed research reports near the end of 2017 and early 2018. We urge you to review these research posts as they tell you exactly what to expect for the first Quarter in 2018.

Continuing this research, we have focused our current effort on the Transportation Index, the US Majors, and the Metals Markets. The Transportation Index has seen an extensive rally (+19.85%) originating near November 2017. This incredible upside move correlates with renewed US Tax policies and Economic increases that are sure to drive the US Equity market higher throughout 2018.

In theory, the Transportation Index is a measure of economic activity as related to the transportation of goods from port to distribution centers and from distribution centers to retail centers. The recent jump in the Transportation Index foretells of strong economic activity within the US for at least the next 3 months.

Get our Free Technical Traders Wealth Building Newsletter….Get it Here 

One could, and likely should watch the Transportation Index for any signs of weakness or contraction which would indicate an economic slowdown about to unfold. In order to better understand how the Transportation Index precedes the US Equity markets by 2-5 months, let’s compare the current price activity to that of 2007-08.

This first chart is the current Transportation Index and shows how strong the US economic recovery is in relation to the previous year (2017). As the US economy has continued to strengthen and open up new opportunities, the Transportation Index has related this strength by increasing by near +20% in only a few short months. This shows us that we should continue to expect a moderate to strong bullish bias for at least the first quarter of 2018 – unless something dramatic changes in relation to economic opportunities.

Current Transportation Index Chart

In comparison, this chart (below) is the Transportation Index in 2007-08 which reacted quite differently. The economic environment was vastly different at this time. The US Fed had raised rates consecutively over a two year period leading up to a massive debt/credit crisis. At the same time, the US had a Presidential Election cycle that saw massive uncertainty with regards to regulation, policies and economic opportunities. Delinquencies as related to debt had already started to climb and the markets reacted to the economic alarms ringing from all corners of the globe. The Transportation Index formed a classic “rollover top” formation in late 2007 and early 2008 well before the global markets really began to tank.

2007-08 Transportation Index Chart

Our analysis points to a very strong first quarter of 2018 within the US and for US Equities. We believe the economic indicators will continue to perform well and, at least for the next 3 months, will continue to drive strong equity growth. We do expect some volatility near the end of the first Quarter as well as continued 2-5% price volatility/rotation at times. There will be levels of contraction in the markets that are natural and healthy for this rally. So, be prepared for some rotation that could be deeper than what we have seen over the last 6 months.

In conclusion, equities are this point are overpriced, and overbought based on the short term analysis. We should be entering slightly weaker time for large cap stocks over the next couple weeks before it goes much higher. Because we are still in a full out bull market, Dips Should Be Bought and we will notify members of a new trade once we get another one of these setups.

In our next post, we are going to talk about two opportunities in precious metals forming for next week!

Read the analysis we presented before the end of 2017 regarding our predictive modeling systems and how we target our research to helping our members. If you believe our analysis is accurate and timely, then we urge you to subscribe here at The Technical Traders to support our work and to benefit from our signals. We believe 2018 – 2020 will be the years that strategic trades will outperform all other markets. Join us in our efforts to find and execute the best trading opportunities and profit from these fantastic setups.

Chris Vermeulen
Technical Traders Ltd.

Stock & ETF Trading Signals

Stock Trkr
Commodity Brief – Containers

The world of commodity trading. Series continues by looking at containers, Richard Watts, Managing Director, HR Maritime. You can view this video and the full video archive on the Dukascopy TV page: http://www.dukascopy.com/tv/en/#222188 Смотрите Dukascopy TV на вашем языке: http://www.youtube.com/user/dukascopytvrussian 用您的语言观看杜高斯贝电视: http://www.youtube.com/user/dukascopytvchinese Miren Dukascopy TV en su idioma: http://www.youtube.com/user/dukascopytvspanish Schauen Sie Dukascopy TV in Ihrer […]

Stock Trkr
Preparing for the Cryptocurrency Swan Event

Our trading partner Chris Vermeulen sent over this great article he put together covering how the current crypto markets volatility might affect the rest of the markets. 

Many people have speculated that Cryptocurrencies can go to $10k or higher. Recently, the Chinese government has stepped up policy to regulate and eliminate Crypto ICOs as a means of increased speculation and gray market capital. Additionally, Jamie Dimon, of JP Morgan, stated that Bitcoin is a fraud and that it would “blow up” (MSN > Bitcoin is a Fraud That Will Blow Up Says JP Morgan Boss). What is the truth and what should investors expect in the future? Well, here is my opinion on this topic.

Bitcoin is based on the Blockchain technology architecture. I believe this architecture will continue to be explored under the basis of an open, distributed ledger method of developing opportunities. This technology improvement will likely drive advancement in other sectors of the global market as security and accountability continue to increase. Yet, the growing pains of this technology will likely continue to drive some wild moves over the next few years.

It has been reported that Cryptocurrencies fell $23 Billion in value since the peak. This would put the total valuation of the Crypto market at about $117 Billion near the same peak. Consider for a moment that the Bernie Madoff scandal was near $65 Billion total. Could a Cryptocurrency based “Swan Event” create chaos in the global markets?

In comparison to more traditional investment instruments, the risk exposure of Cryptocurrencies seems somewhat limited. Yet consider this… Many global firms jumped onto the Blockchain bandwagon within the last 12~24 months. This is not just individual investors any longer, this is most of the global financial market.

DATE TIMELINE OF FIRST INVESTMENT INTO CRYPTOCURRENCIES

So, now our “Swan Event” has a bit of depth in terms of risk exposure and breadth in terms of global market reach. What would an extended decline in Cryptocurrency valuations do to these firms and to the confidence in the Cryptocurrency market?

Could a collapse “Swan Event” drive prices back to below $1000 (USD) or further? What would the outcome of such an event be like for the global markets? Would this type of move reflect into the global market as an advance or decline overall? And what would this mean to the bottom line of these financial firms that have invested capital, resources and client’s capital into these markets?

It is our believe that the global markets are, without a Cryptocurrency event, setting up for a potentially massive corrective move. The chart, below, clearly shows what we believe to be a Head-n-Shoulders pattern forming that will likely prompt a breakdown move near October 2017 or shortly thereafter.

We believe this global market correction will prompt selling in weaker instruments and drive a massive “rip your face off” rally in the metals. We believe this move has already started with the formation of the Head-n-Shoulders pattern in the US markets as well as the recent upside move in the metals. The Cryptocurrency “Swan Event” may be the catalyst event that is needed to put pressure on other market instruments (US and Global equities, RealEstate, Consumer confidence/spending and Metals).

U.S. CUSTOM INDEX….HEAD-N-SHOULDER FORMATION

METALS : START OF RIP YOUR FACE OFF RALLY

REAL ESTATE CORRECTION

Are you prepared for this move? Do you want to know what to expect and do you need help understanding these market dynamics? The markets are setting up for what could be one of the most explosive cycle event moves in nearly a decade and you need to be prepared. We offer our research to our clients at The Market Trend Forecast for far less than you would imagine. For less than $1 per day, you can have access to our advanced research and analytics, market trend forecasts and more. We keep you informed with our timely updates and research to help you understand how these markets are moving, where to find opportunities and how to protect your investments.

Our research team has over 30 years experience in the markets and have been trained by some of the best technicians that ever lived. Isn’t it time you invested in a team of dedicated market analysts that can help you protect your assets and find opportunities for an unbelievable subscription rate?

When you join, we’ll send your our Guide to understanding trading PDF booklet to help you understand our advanced analysis techniques and adaptive learning strategies. These are all part of our commitment to providing you the best analysis, research and understanding of the market’s dynamics as well as making sure you understand what we are delivering to you each week.

Don’t miss this next big move, the “Swan Event”….Timing is everything.

Visit The Technical Traders Right Here to see what we are offering you.

Chris Vermeulen

Just Getting Started Trading Cryptocurrency?  Get $10.00 Worth of FREE Bitcoin Right Here

Stock Trkr
2018 First Quarter Technical Analysis Price Forecast

As 2017 draws to a close, our analysis shows the first Quarter of 2018 should start off with a solid rally. Our researchers use our proprietary modeling and technical analysis systems to assist our members with detailed market analysis and timing triggers from expected intraday price action to a multi-month outlook.

These tools help us to keep our members informed of market trends, reversals, and big moves. Today, we are going to share some of our predictive modelings with you to show you why we believe the first three months of 2018 should continue higher.

One of our most impressive and predictive modeling systems is the Adaptive Dynamic Learning system. This system allows us to ask the market what will be the highest possible outcome of recent trading activity projected into the future. It accomplishes this by identifying Genetic Price/Pattern markers in the past and recording them into a Genome Map of price activity and probable outcomes.

This way, when we ask it to show us what it thinks will be the highest probable outcome for the future, it looks into this Genome Map, finds the closest relative Genetic Price/Pattern marker and then shows us what this Genome marker predicts as the more likely outcome.

This current Weekly chart of the SPY is showing us that the next few Weeks and Months of price activity should produce a minimum of a $5 – $7 rally. This means that we could see a continued 2~5% rally in US Equities early in 2018.

Additionally, the ES (S&P E-mini futures) is confirming this move in early 2018 with its own predictive analysis. The ADL modeling system is showing us that the ES is likely to move +100 pts from current levels before the end of the first Quarter 2018 equating to a +3.5% move (or higher). We can see from this analysis that a period of congestion or consolidation is expected near the end of January or early February 2018 – which would be a great entry opportunity.

The trends for both of these charts is strongly Bullish and the current ADL price predictions allow investors to understand the opportunities and expectations for the first three months of 2018. Imagine being able to know or understand that a predictive modeling system can assist you in making decisions regarding the next two to three months as well as assist you in planning and protecting your investments? How powerful would that technology be to you?

Our job at Technical Traders Ltd. is to assist our members in finding and executing profitable trades and to assist them in understanding market trends, reversals, and key movers. We offer a variety of analysis types within our service to support any level of a trader from novice to expert, and short term to long term investors.

Our specialized modeling systems allow us to provide one of a kind research and details that are not available anywhere else. Our team of researchers and traders are dedicated to helping us all find great success with our trading.

So, now that you know what to expect from the SPY and ES for the next few months, do you want to know what is going to happen in Gold, Silver, Bonds, FANGs, the US Dollar, Bitcoin, and more?

Join The Technical Traders Right Here to gain this insight and knowledge today.

Chris Vermeulen

Stock & ETF Trading Signals

Stock Trkr
Today’s Gap Fill and Prediction Complete, What’s Next?

Subscribers of our Technical Traders Wealth Building Newsletter were told before the market opened that stocks were set to gap higher and then fill the price gap. Only 12 minutes after the market opened the gap window was filled for a 9.5 pt move in th…

Stock Trkr